
Table Display#
The Table Display page will look like
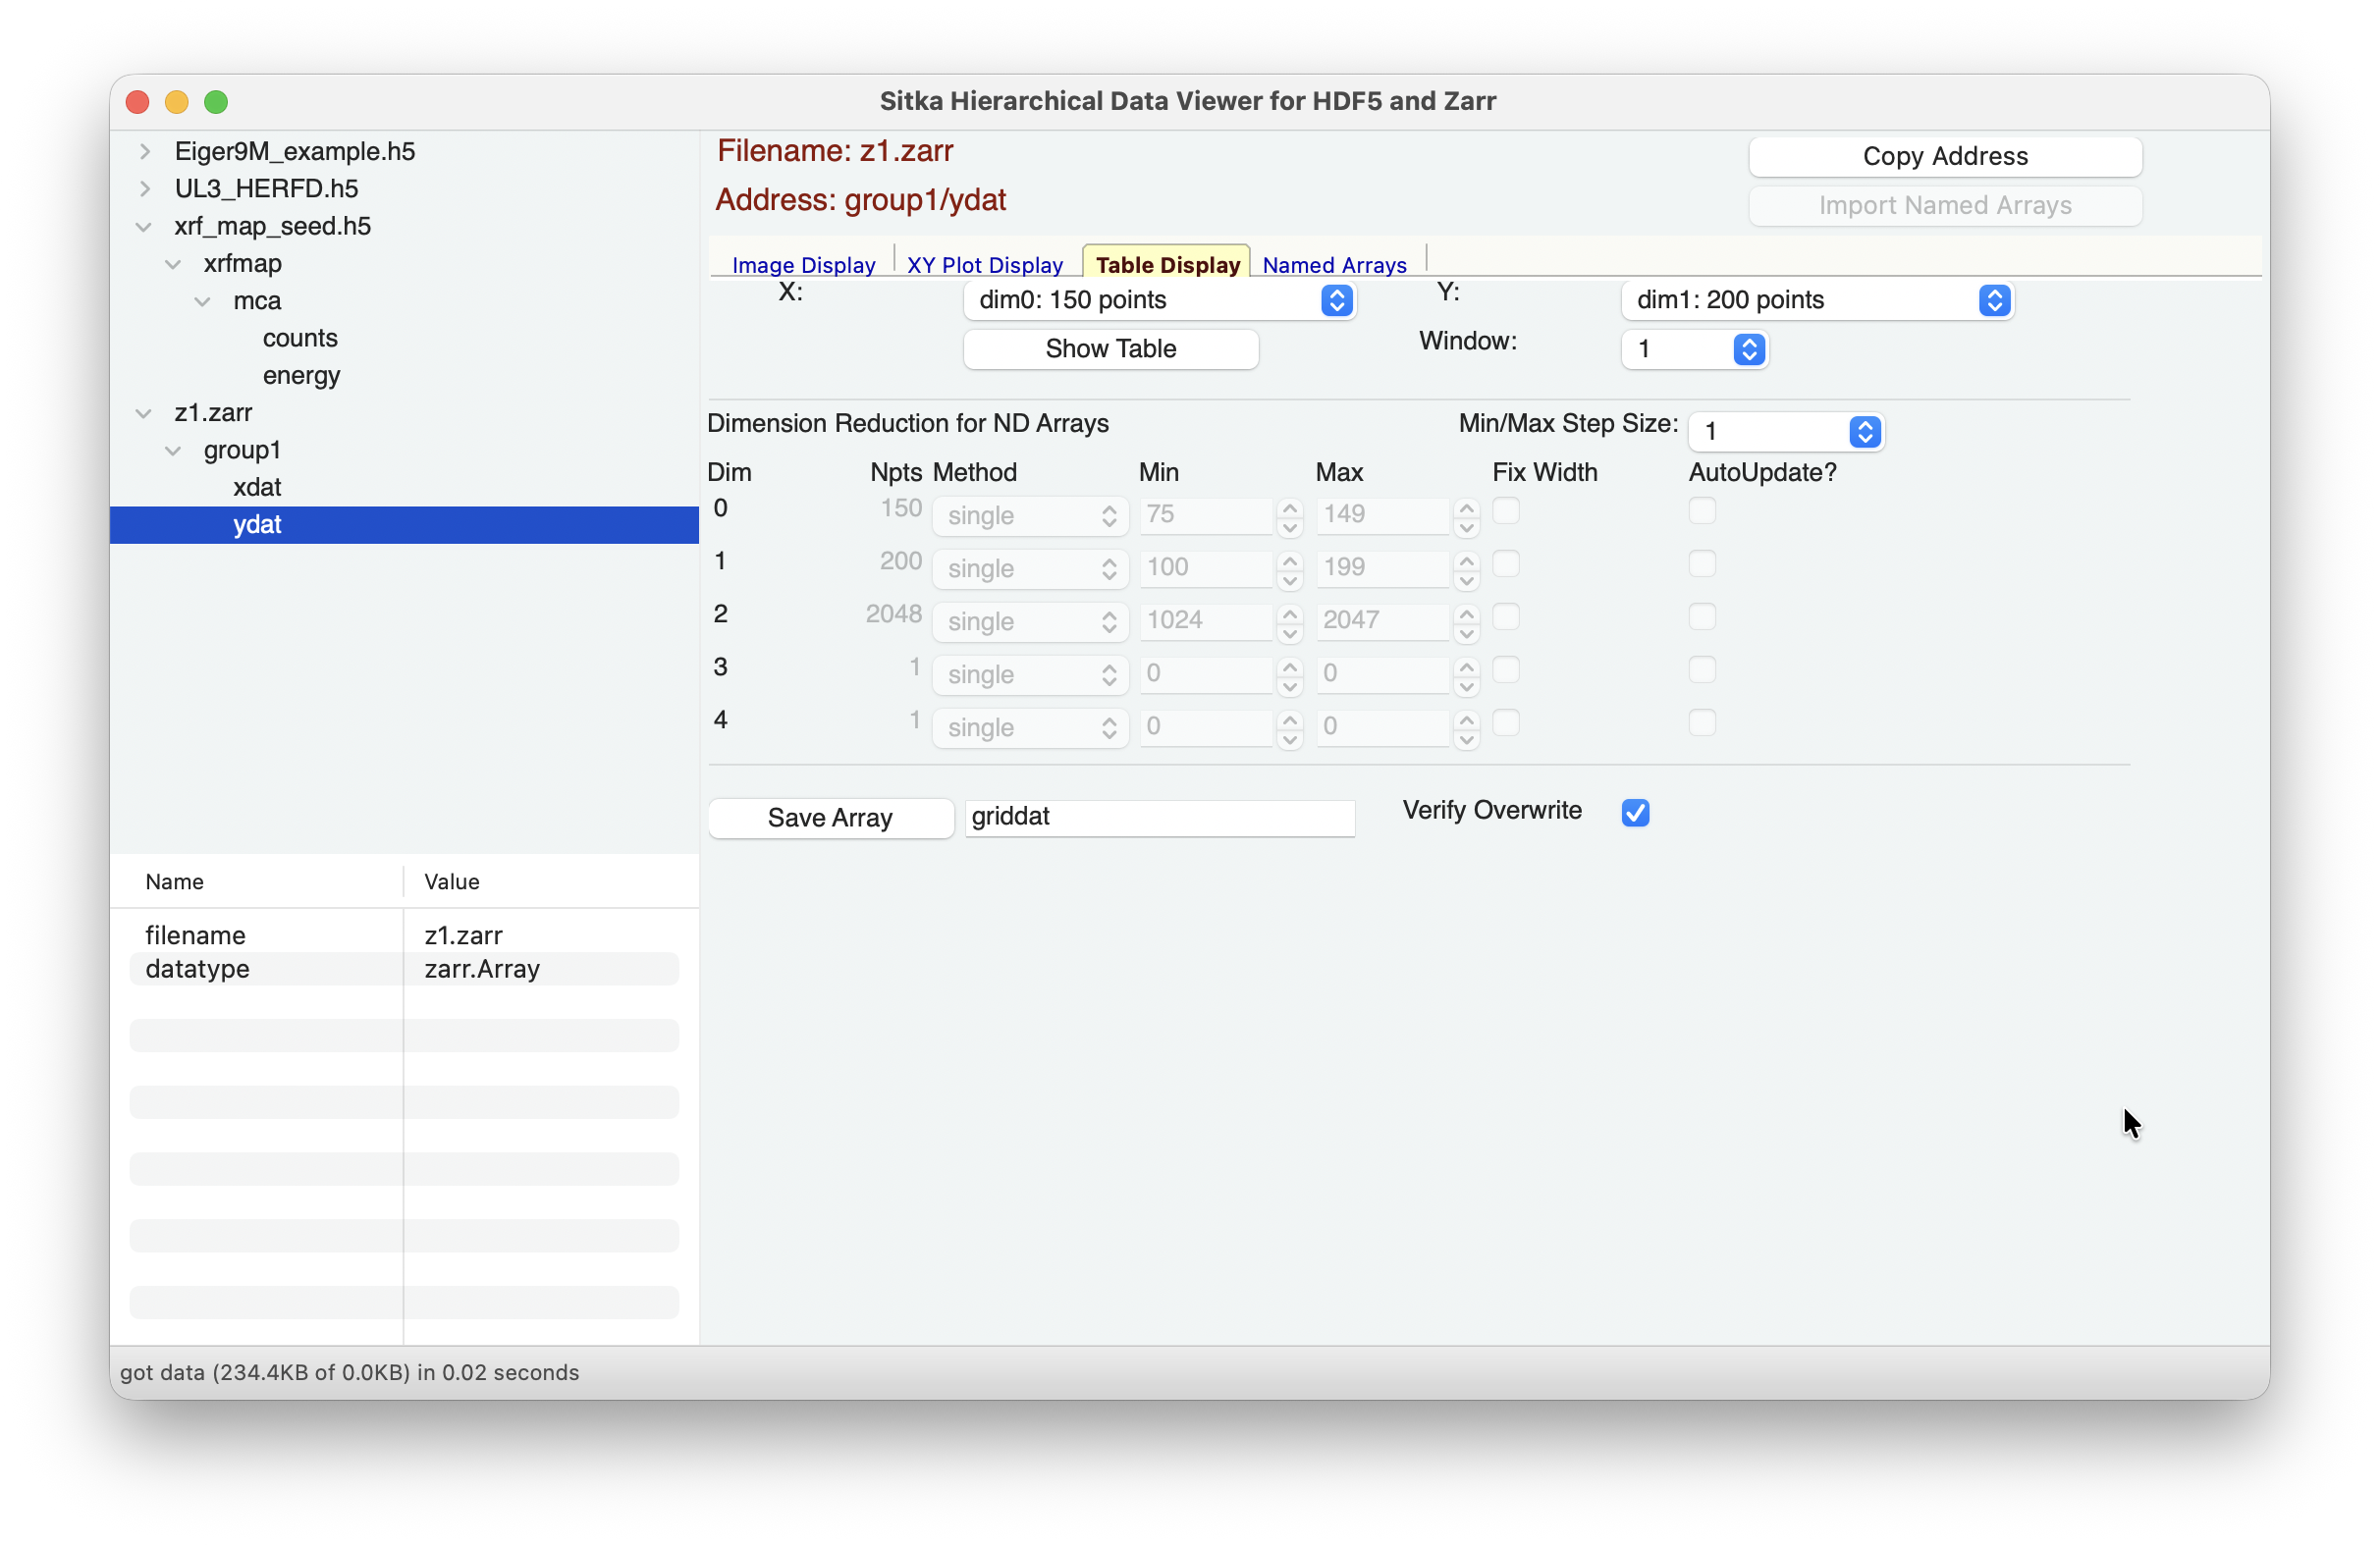
and allow you show Grid-like tables of values for arrays.
In the top Array Selection section, you can select the dimension for Y (the vertical axis) and X (the horizontal axis). The choices for dimensions and number of points will be automatically updated for each dataset, following the shape values (shown in the Info section).
For data arrays that have 3- or more dimensions, changing the selections for the Y and X dimensions will automatically change how the contents of the Dimension Reduction is presented. See The Dimension Reduction Panel for information about how you can use this.
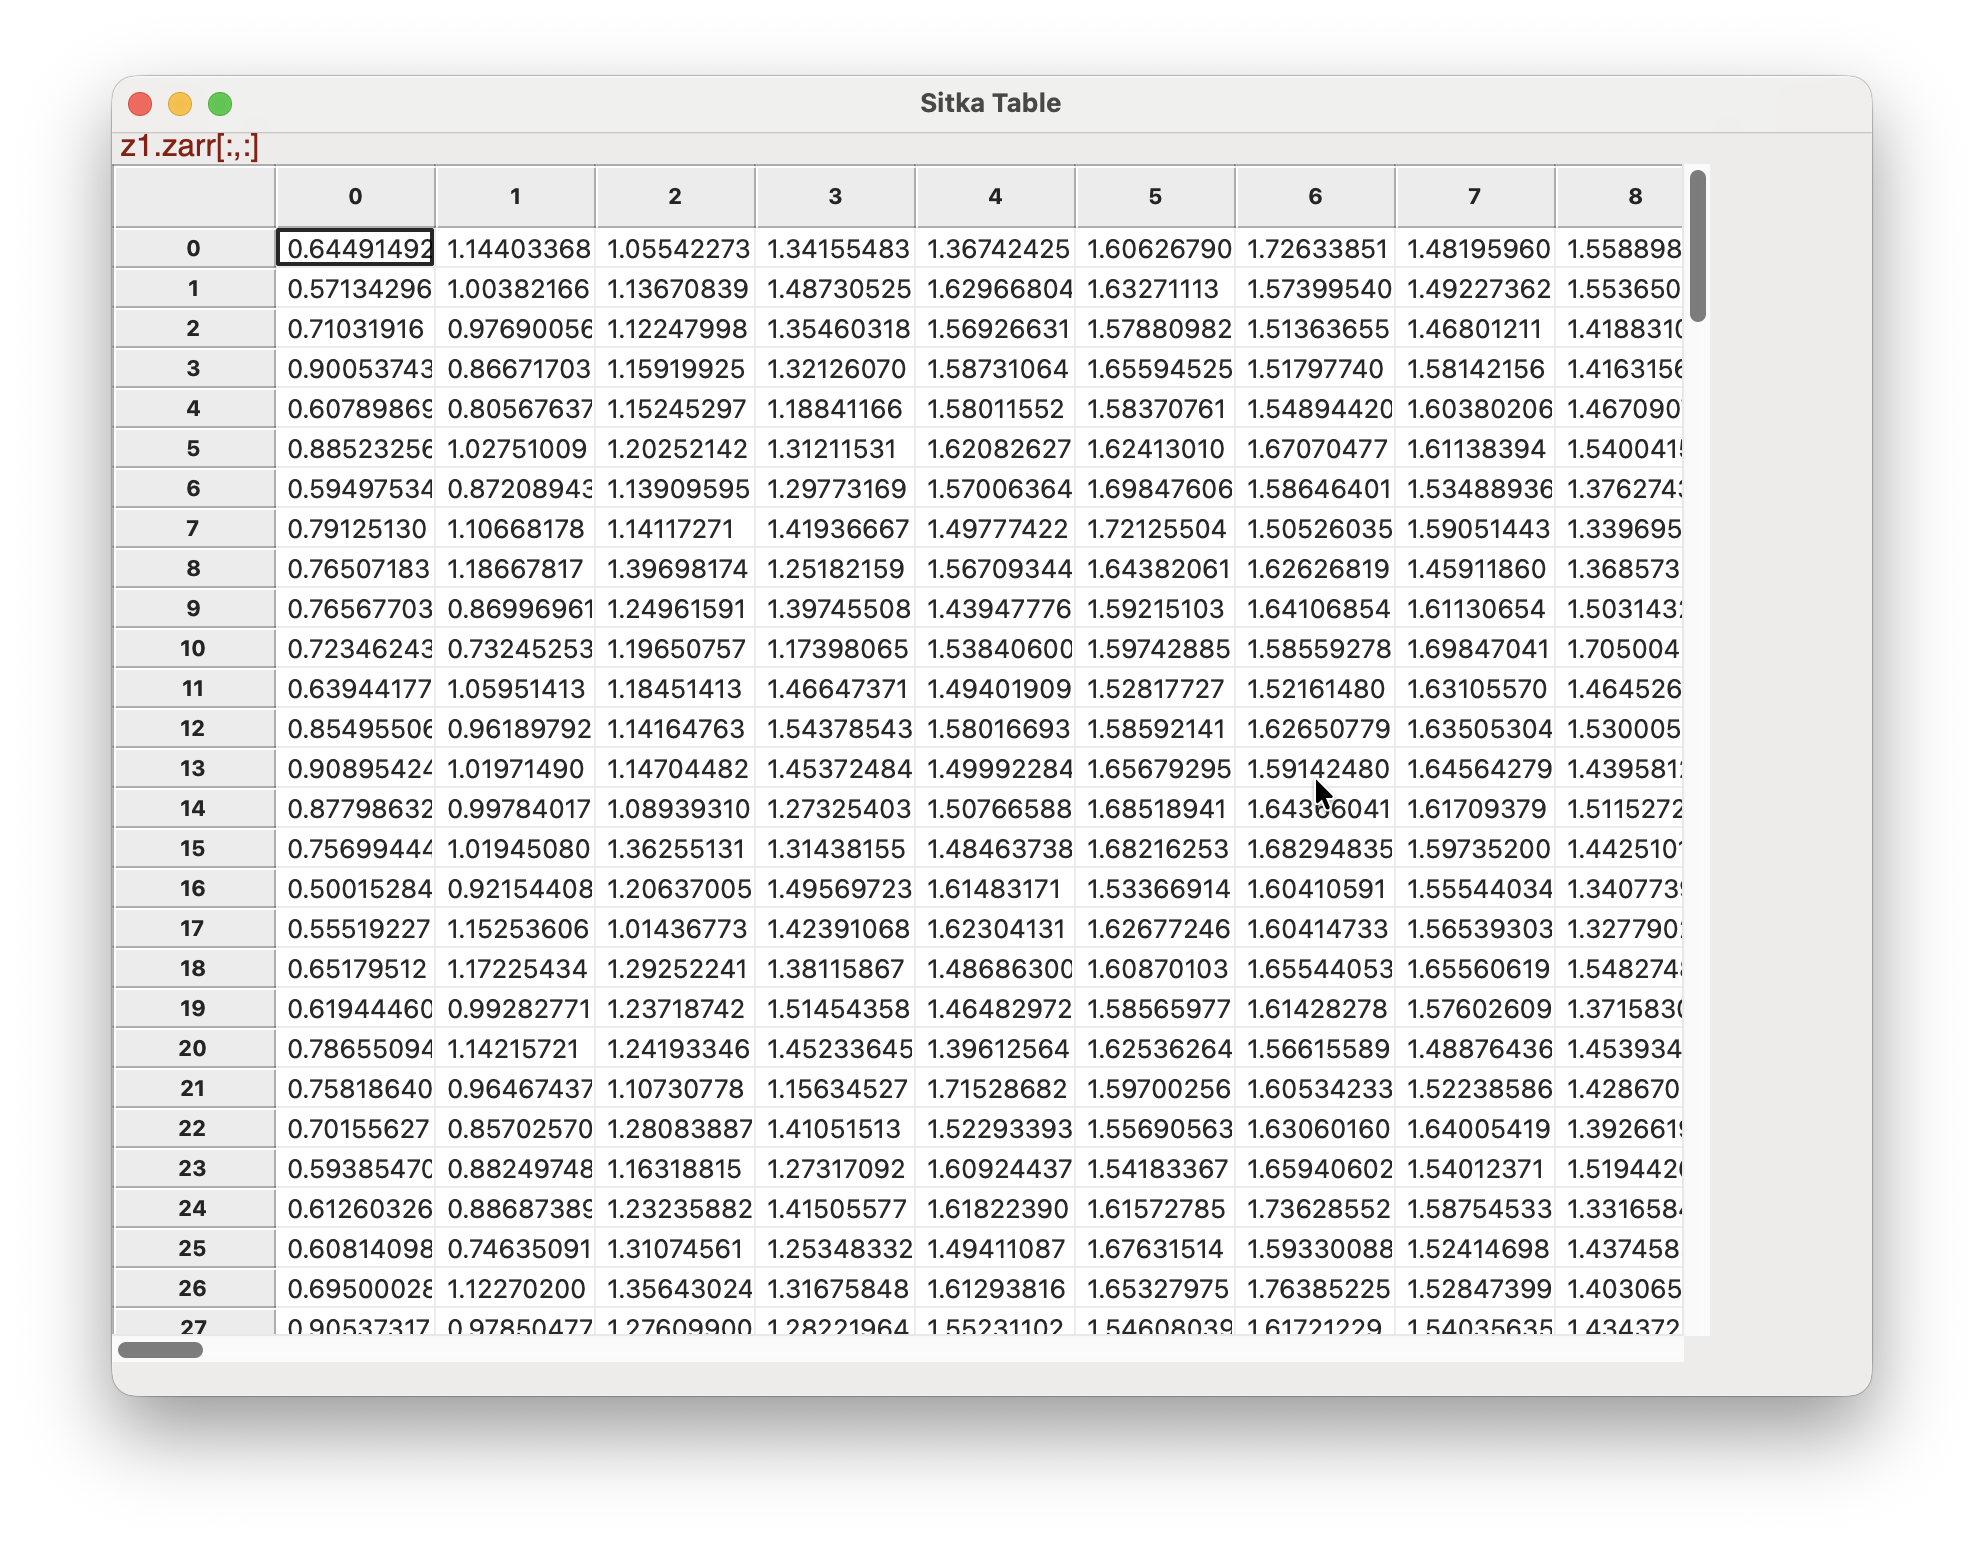
From the Sitka Table Window, you can save a tab-separated-value file for displayed data with the File->Export Data to TSV menu.