
Image Display#
The Image Display page will look like
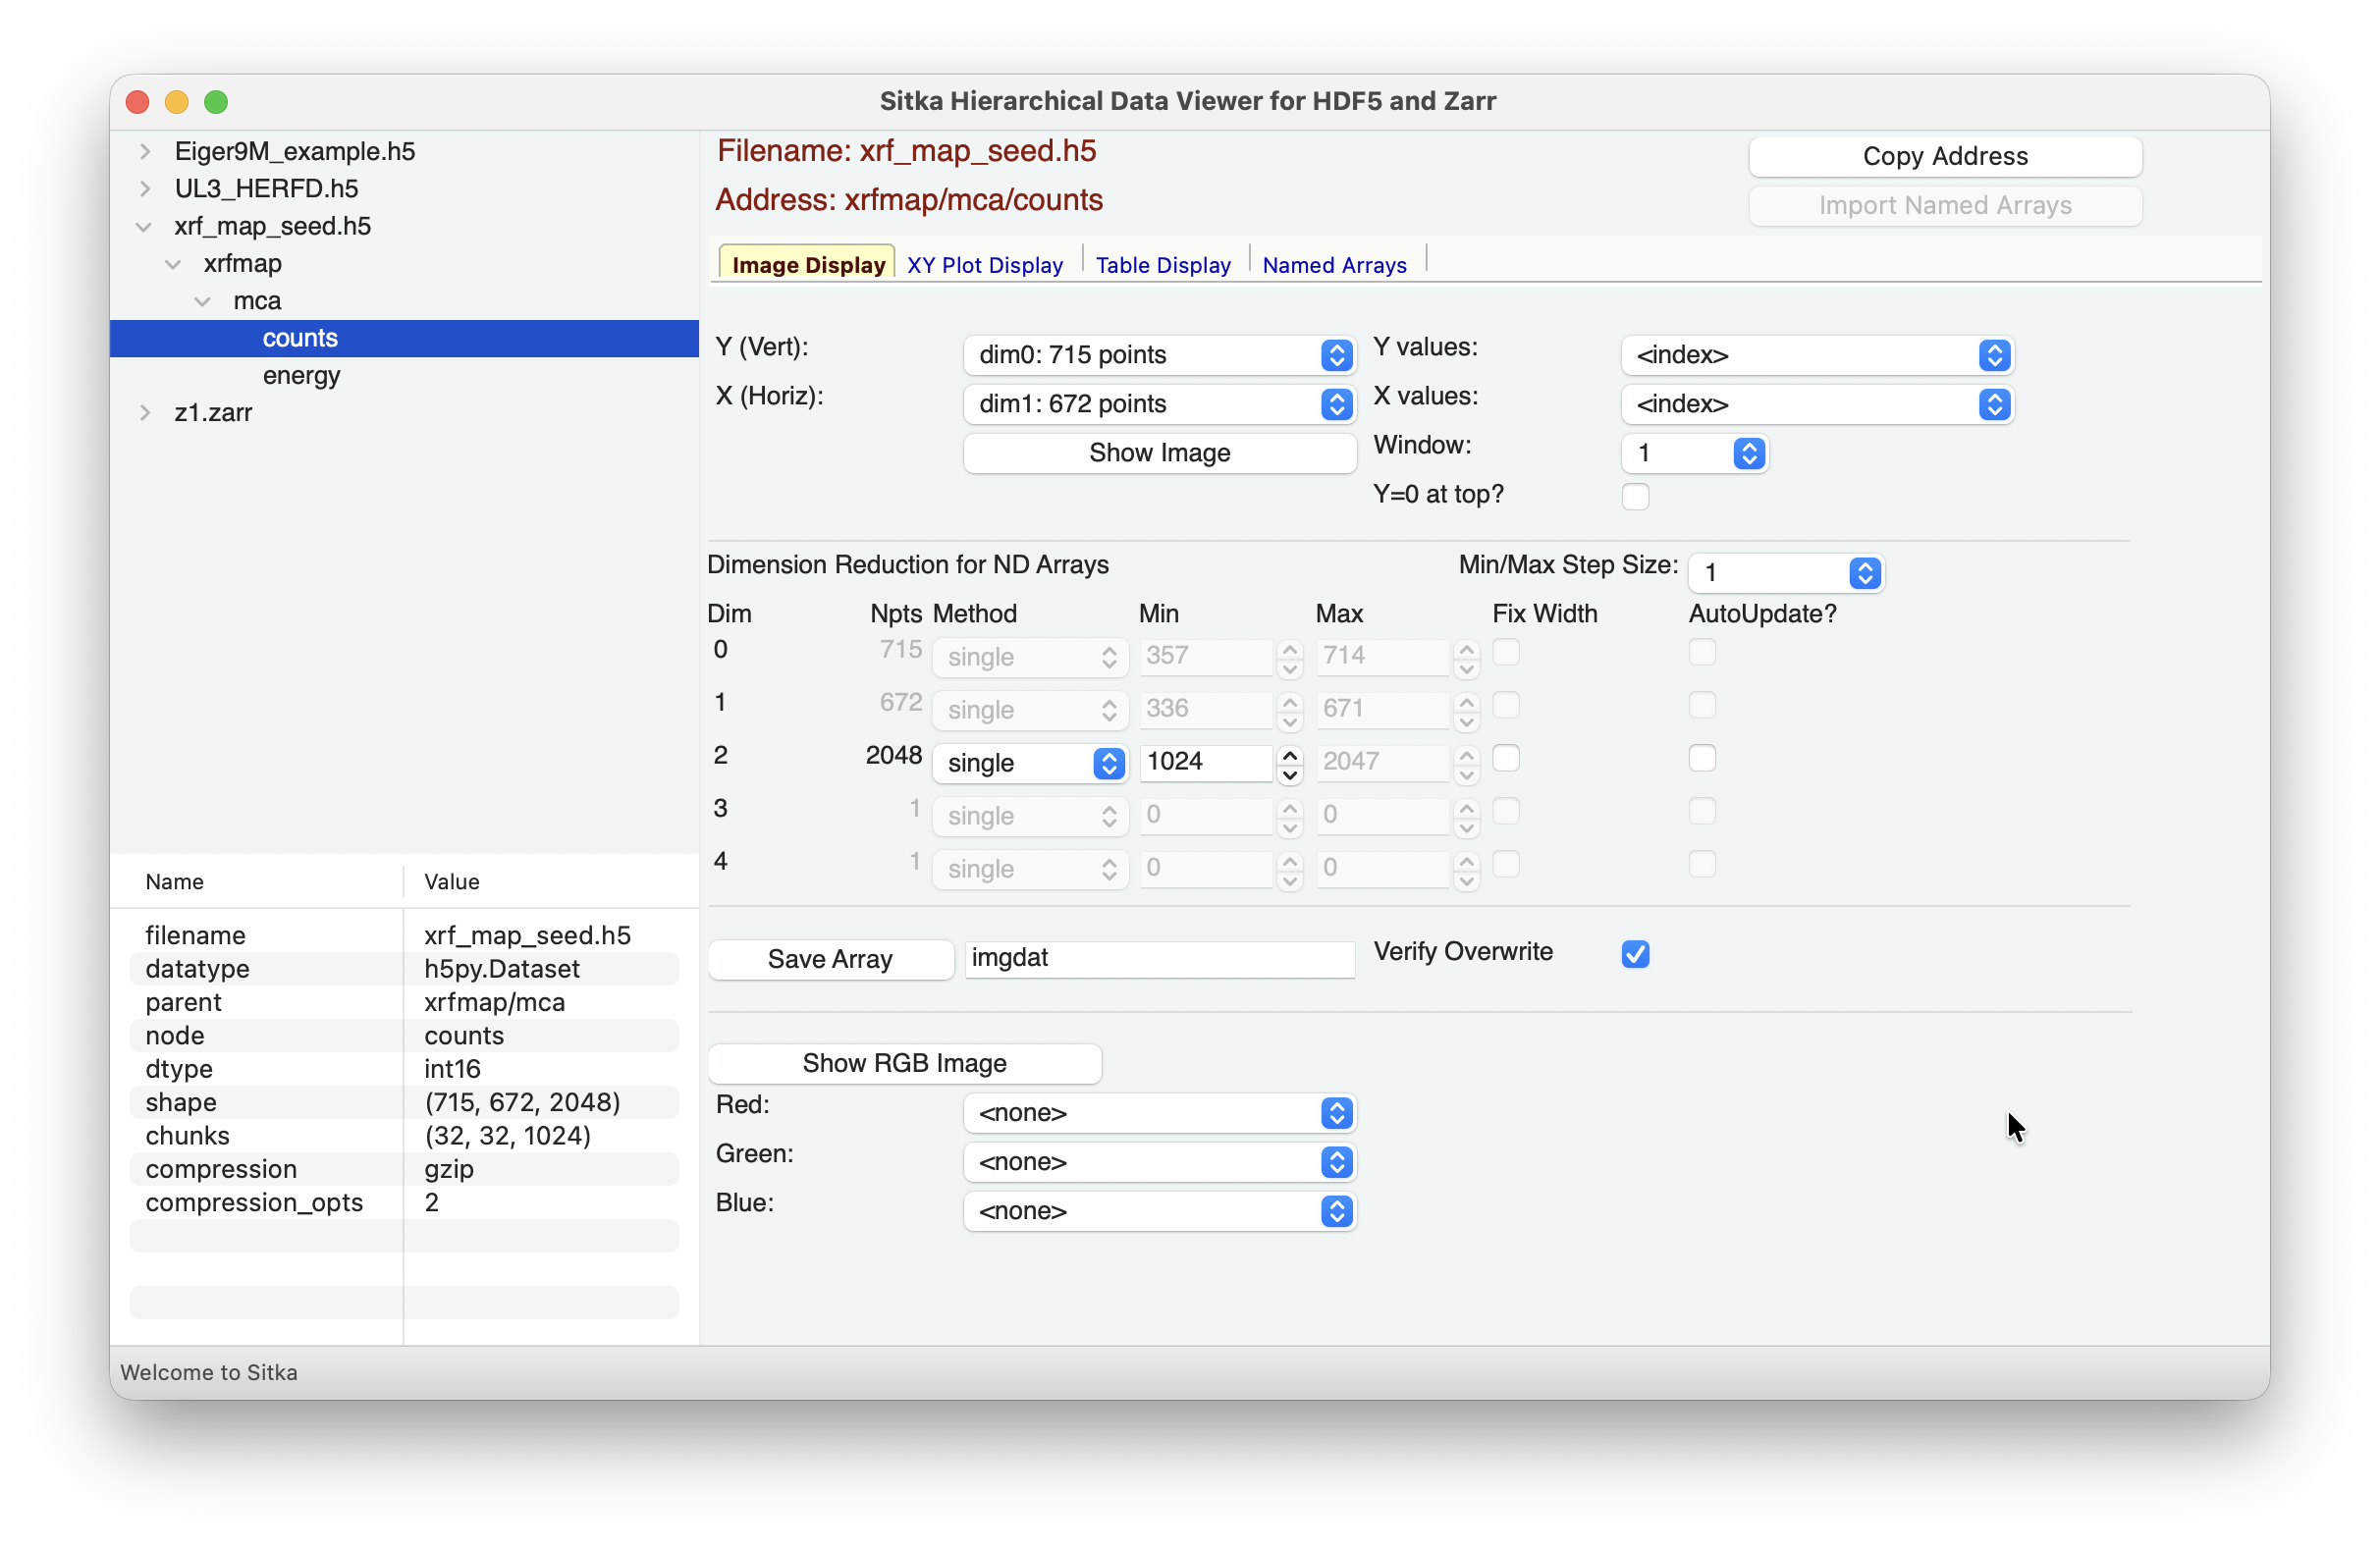
and allow you make images or false-color maps of the multi-dimensional data.
In the top Array Selection section, you can select the dimension for Y (the vertical axis) and X (the horizontal axis). The choices for dimensions and number of points will be automatically updated for each dataset, following the shape values (shown in the Info section).
For data arrays that have 3- or more dimensions, changing the selections for the Y and X dimensions will automatically change how the contents of the Dimension Reduction is presented. See The Dimension Reduction Panel for information about how you can use this.
If you have named 1-D arrays of the appropriate length, these will be included in the drop-down lists for the “Y values” or “X values”, to give dimensions to the resulting image. By default, the array index will be used.
To show an image for your selected arrays, but the “Show Image” button. You can also select the window display number to show multiple images at a time. Each of these will look like:
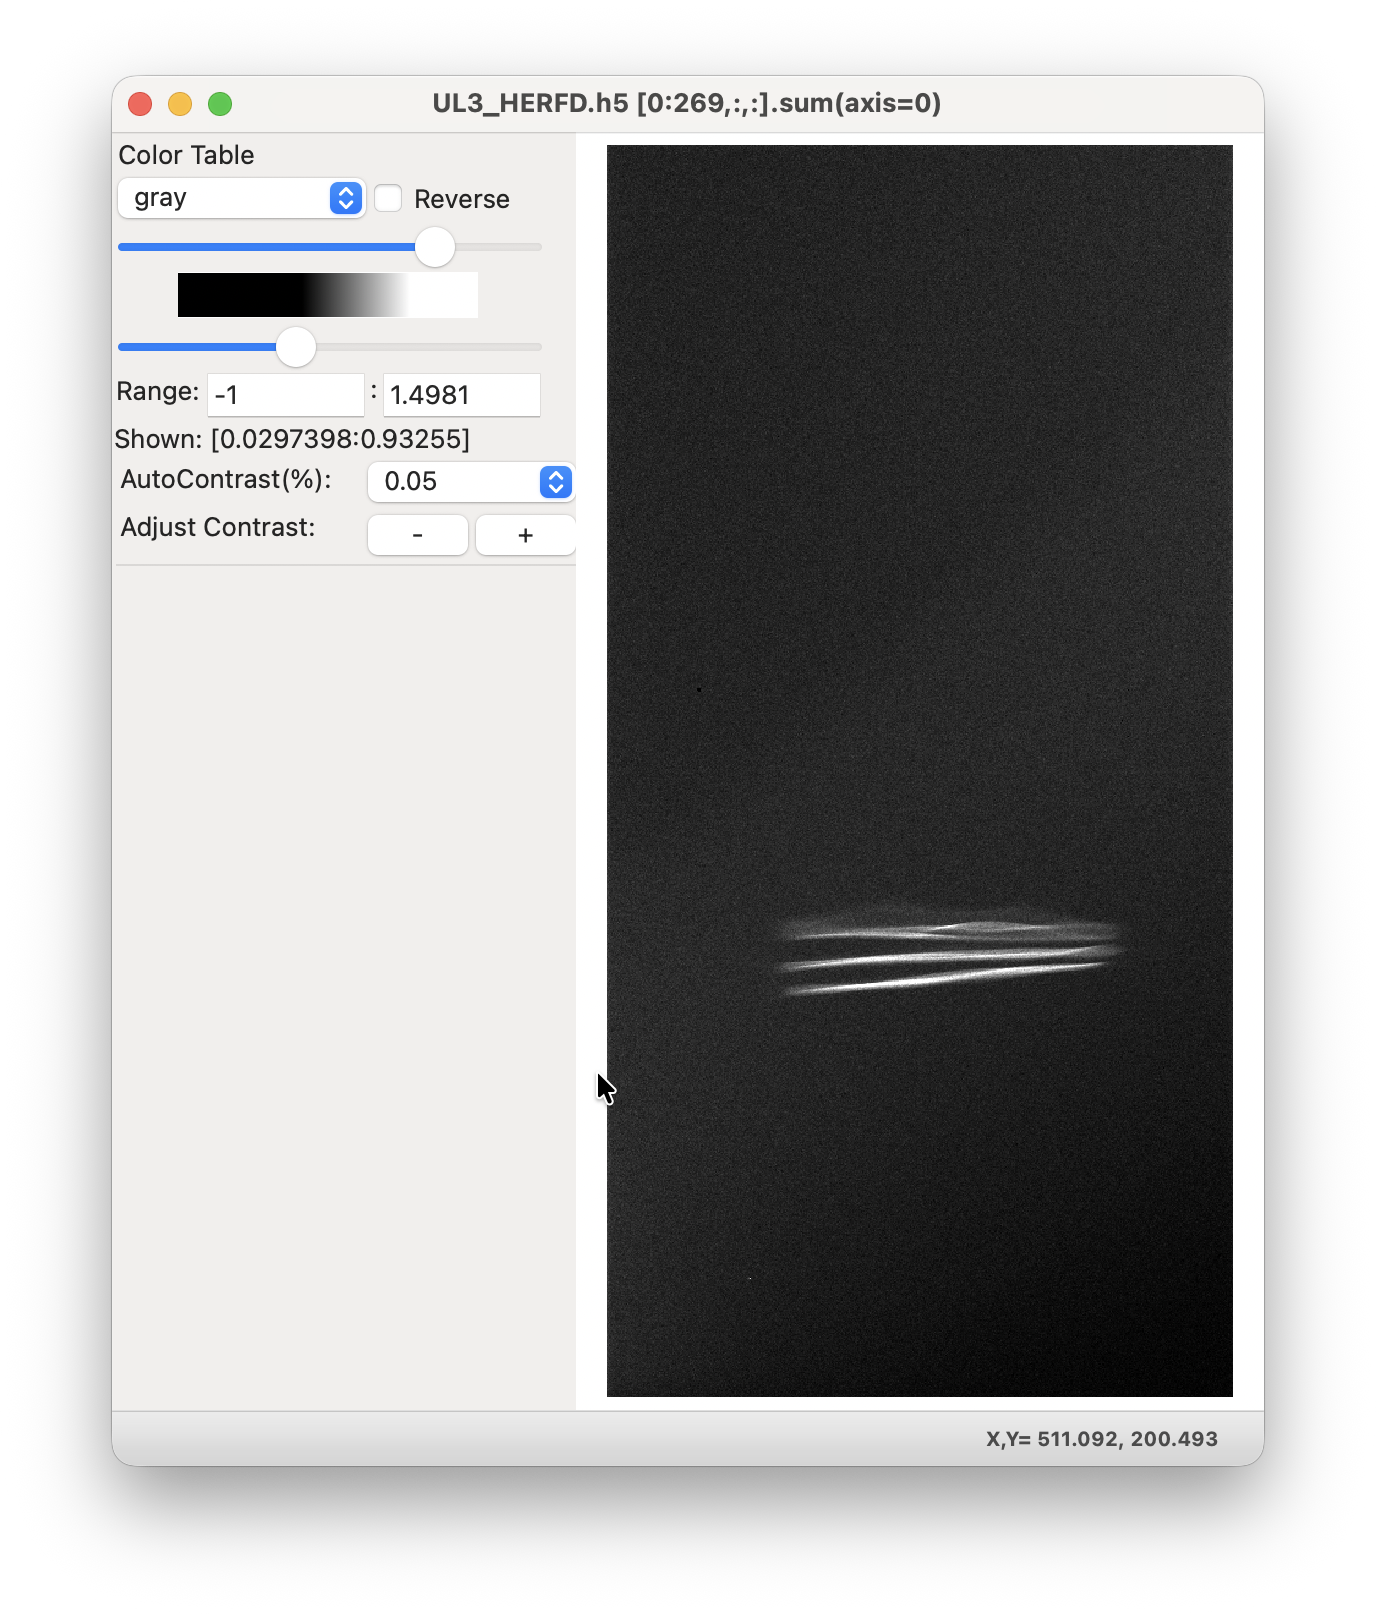
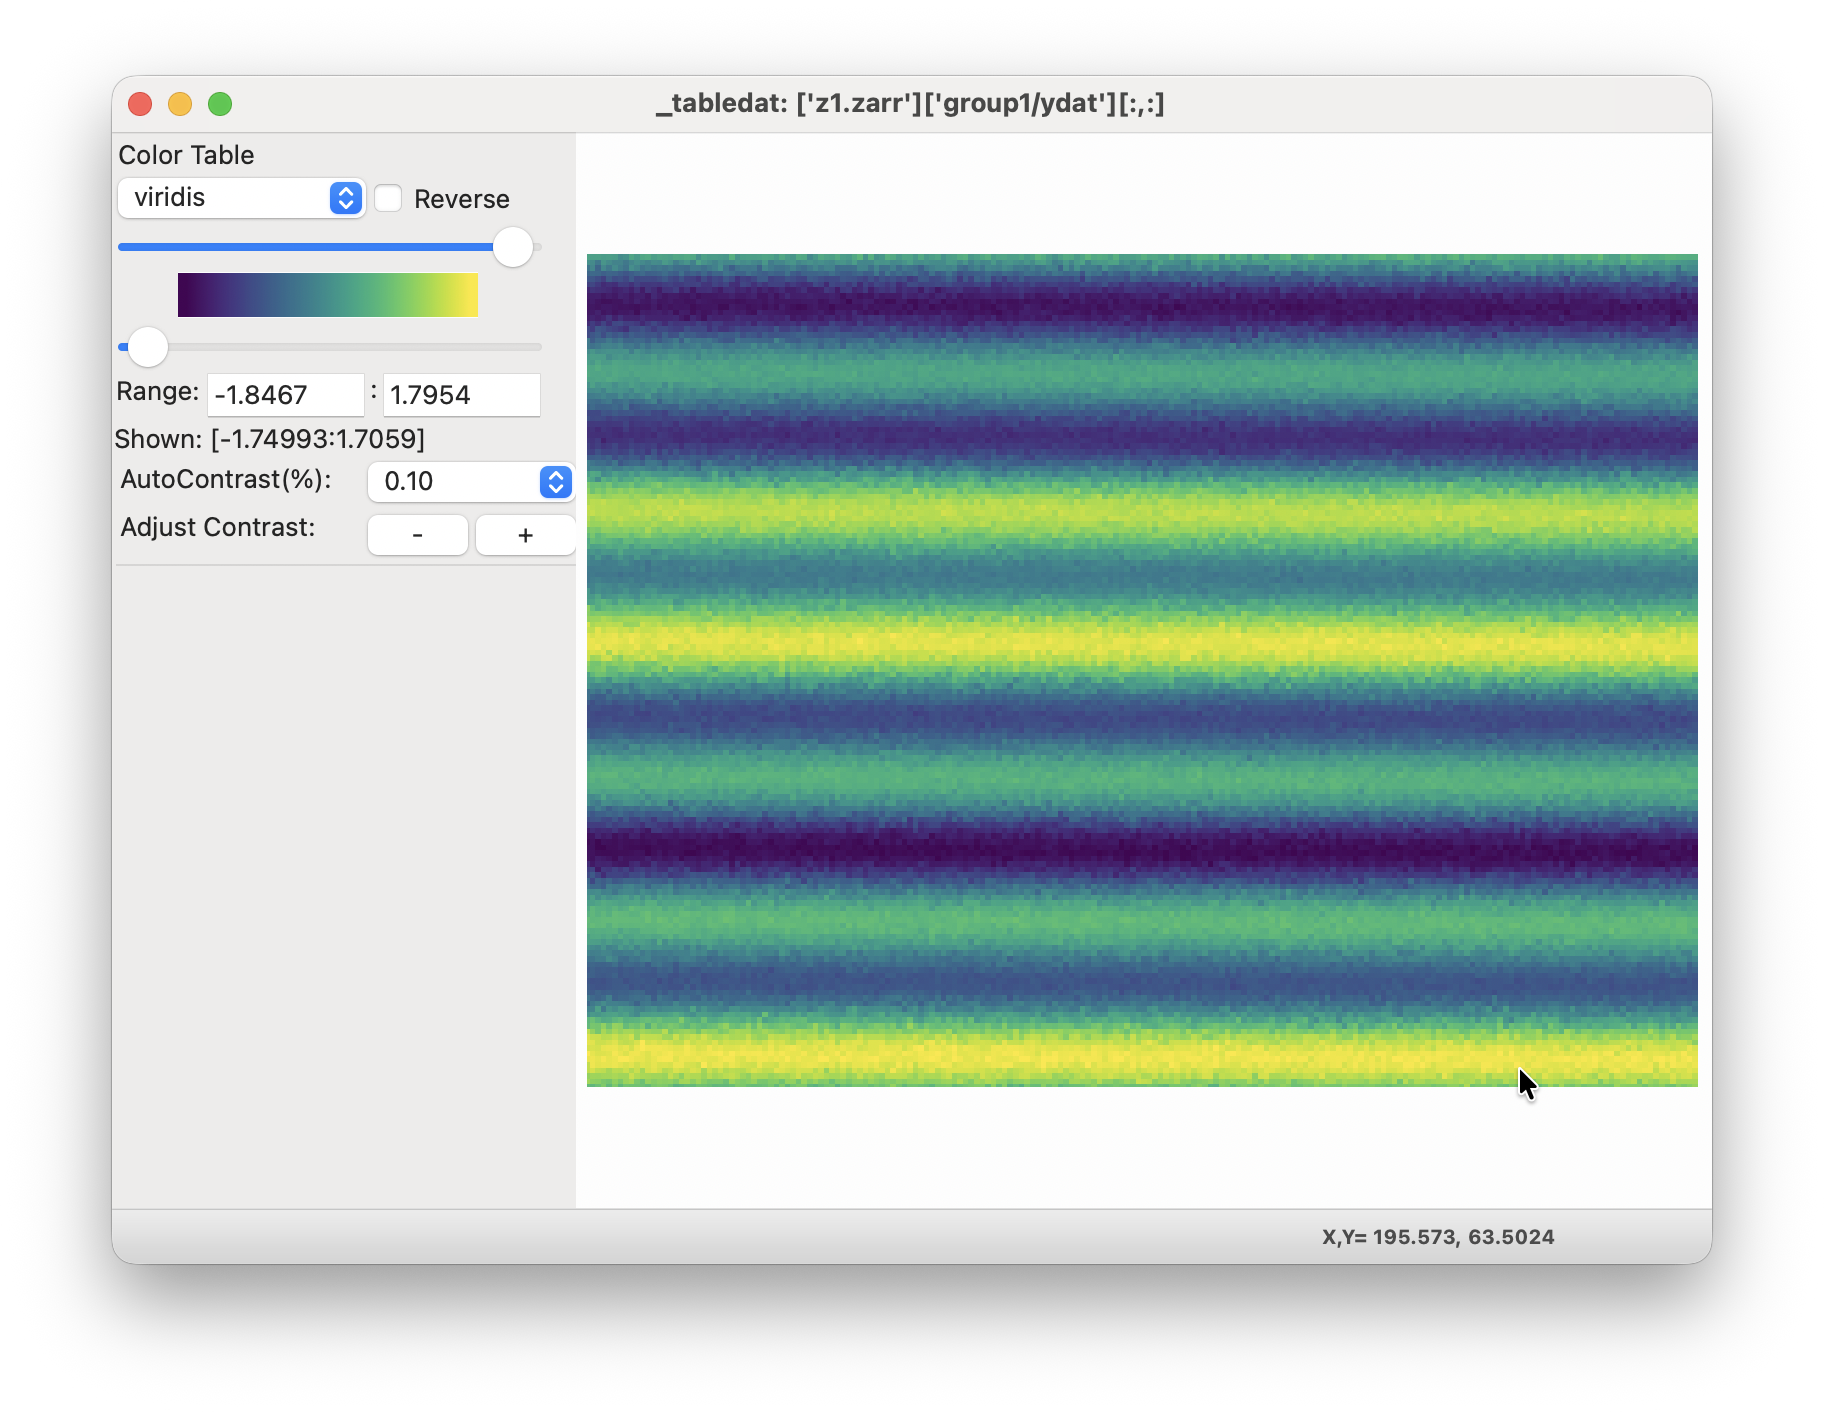
These image displays are fully interactive, and allowing zooming, rotating, flipping, and smoothing. Axes, grid lines, and scale bars can be configured and shown after the image is displayed. Histograms of values can be shown, as can slices through the image. The image can be quantized into a contour plot, and the contour levels can be adjusted. The image can be saved to a PNG file or copied to the system clipboard (with Ctrl-C), and the data array exported to a text file. A wide selection of color table can be used. The upper and lower levels can be adjusted by hand or by selecting or stepping through a range of “percent contrasts” which give good and easily reproducible results for datasets with extreme outliers or high dynamic range. For more details using this image display, see WXMPLOT Interactive Image Display
If you have saved multiple images of the same shape – perhaps different slices of a third dimension for a 3-d dataset – then you can use the “Red: “, “Green: “, and “Blue: “ choices to select 2 or 3 arrays of the same shape to show as an image with each array in Red, Green, or Blue.