
16.1. XRF Data: MCA and ROI objects
XRF spectra are typically measured with MCAs (Multi Channel Analyzers) which holds an array of intensities. Because of the long history of using MCAs to store XRF spectra, the two concepts are often mixed, and one often talks about MCA traces as being the same as XRF spectra. To be sure, an XRF spectrum \(I(E)\) can be represented well with an MCA trace (intensities per bin) as long as one can convert bin number to energy. Fortunately, most measurement systems in use have a linear relation (calibration) between bin number and energy, and the use of an MCA trace as an XRF spectrum is straightforward. We will probably use the terms interchangeably here as well.
Just to be clear: an XRF spectrum collected by an MCA will have a one dimensional array of counts with a single, well-defined energy for each bin. There will typically be between 1000 and 10,000 bins in each spectrum.
An ROI (Region of Interest) is a continuous portion of the XRF spectrum, generally representing a range of energies corresponding to a particular peak or X-ray emission line or family of lines. One often sums the counts in such an ROI to give a total number of counts for that emission line. An MCA spectrum may have many (typically 10s) of ROIs defined for particular emission lines.
In Larch, MCAs and ROIs are exposed as Groups, each with several
attributes, and some built-in functions. For example, An MCA has arrays
for energy and counts, as well as values for real_time and
live_time, a deadtime correction factor dt_factor, and several
ROIs. Each ROI has a left and right channel index, and a
roi.get_counts() method.
16.1.1. Creating MCA objects
A simple way to create an MCA object is to read one from a disk file. For
data collected at GSECARS, this can be done with the read_gsemca()
function.
- read_gsemca(filename)
read a GSECARS MCA spectra file, returning a Group
- Parameters:
filename – name of GSECARS MCA file
The returned Group has the following components:
component name
description
filename
name of file
mcas
list of MCA objects for each MCA saved in the file
rois
list of ROIs
environ
list of Environmental Variables
energy
array of energy values
counts
array of counts, deadtime corrected and summed over MCAs
raw
array of counts, summed over MCAs, not corrected.
calib
dictionary of calibration values
dt_factor
deadtime correction factor
real_time
real time for data acquisition
live_time
live time for data acquisition
nchans
number of energy points in spectra
get_roi_counts()
function to get counts for a named ROI
save_mcafile()
function to save MCA to file
- xrf_plot(energy, counts, mca=None)
create an interactive window for displaying an X-ray Fluorescence spectra
- Parameters:
energy – array of energy values
counts – array of counts
mca – MCA group (as read from
read_gsemca()), containing ROI definitions, calibration values, and related data.
An example plot is shown below
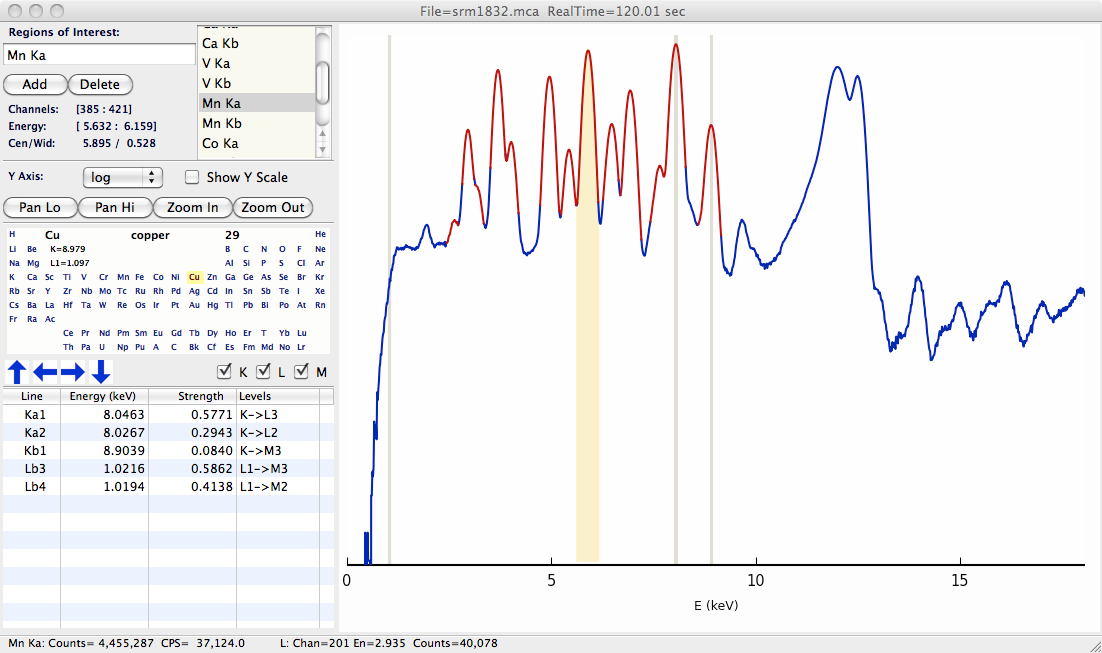
Figure 16.1.1.1 Example XRF Display, showing X-ray Fluorescence spectra, defined ROIs (in red), and Periodic Table for showing predicted emission lines.