\(\newcommand{\AA}{\unicode{x212B}}\)
Calculations of X-ray properties of materials
This section presents several detailed examples of using xraydb.sqlite to calculate X-ray properties of materials. All of the examples here us the functions in the python xraydb module, which is describe in more detail in the next chapter, Using XrayDB from Python. The examples will explore some aspects of X-ray physics, but will not give a complete tutorial on the concepts here. For a good reference on X-ray physics, see [Als-Nielsen and McMorrow (2011)].<
Many of these calculations are also available at XrayDB Web App (xrayabsorption.org).
X-ray attenuation by elements
The XrayDB database tabulates values of the X-ray mass attenuation coefficient, \(\mu/\rho\), for each element. In most of the X-ray regime used in materials characterization (say, up to 150 keV), the photo-electric effect is the main process that causes X-ray attenuation. When the photo-electric process is dominant, the values for \(\mu/\rho\) depends strongly on Z of the atom and on X-ray energy E. In addition to these strong dependencies, sharp increases – so-called absorption edges – with be see at energies of bound core electron levels of atoms. To illustrate these characteristics, the following script will plot \(\mu/\rho\) for selected elements:
#!/usr/bin/env python
# XrayDB example script python/examples/mu_elements.py
#
# plot X-ray mass attenuation for selected elements
#
import numpy as np
import matplotlib.pyplot as plt
import wxmplot.interactive as wi
from xraydb import mu_elam , atomic_symbol

energy = np.arange(500, 120000, 10)  # energy in eV

for elem in ('C', 'Cu', 'Au'):
    mu = mu_elam(elem, energy)
    plt.plot(energy, mu, label=elem, linewidth=2)

plt.title('X-ray mass attenuation')
plt.xlabel('Energy (eV)')
plt.ylabel(r'$\mu/\rho \rm\, (cm^2/gr)$')
plt.legend()
plt.yscale('log')
plt.xscale('log')
plt.show()
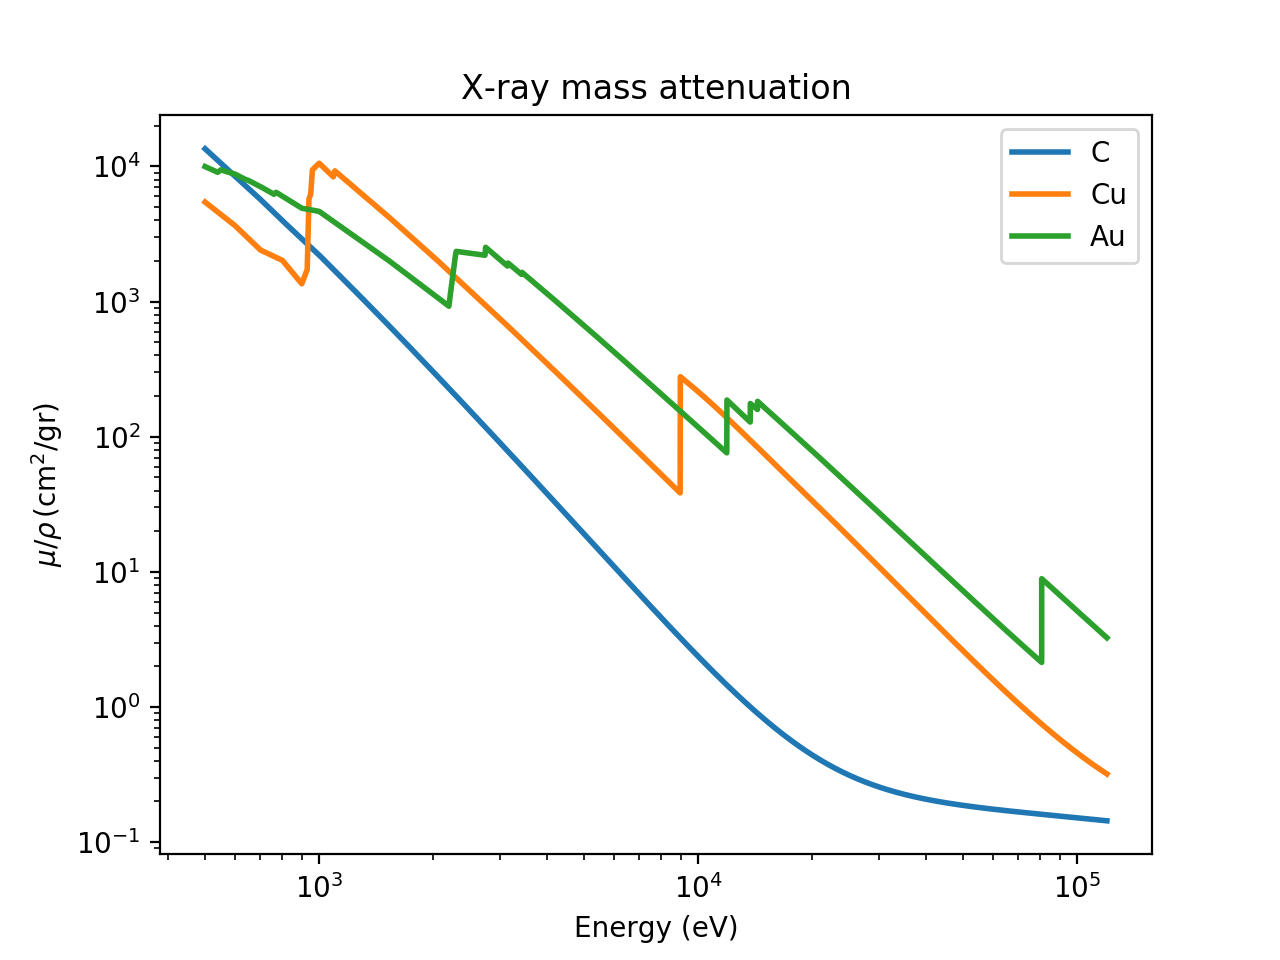
X-ray mass attenuation coefficient for C, Cu, and Au.
As you can see in Figure from this figure, the attenuation drops very strongly with \(E\) – approximately as \(E^3\). \(\mu\) also depends strongly with Z, though the sharp absorption edges make this more complicated.
You can also observe that at relatively high energies for relatively low-Z elements (such as C above about 20 keV) that the attenuation levels off. This is because the coherent (Rayleigh) and incoherent (Compton) scattering processes dominate, so that the photo-electric absorption is no longer the dominant X-ray scattering process. This can be illustrated by plotting the different components of \(\mu/\rho\) for C, as with the following script:
#!/usr/bin/env python
# XrayDB example script python/examples/mu_components_C.py
#
# plot components of X-ray mass attenuation for C
#
import numpy as np
import matplotlib.pyplot as plt
from xraydb import mu_elam

energy = np.arange(500, 120000, 10)  # energy in eV

elem = 'C'
mu_total = mu_elam(elem, energy, kind='total')
mu_photo = mu_elam(elem, energy, kind='photo')
mu_incoh = mu_elam(elem, energy, kind='incoh')
mu_coher = mu_elam(elem, energy, kind='coh')

plt.title('X-ray mass attenuation for %s' % elem)
plt.plot(energy, mu_total, linewidth=2, label='Total')
plt.plot(energy, mu_photo, linewidth=2, label='Photo-electric')
plt.plot(energy, mu_incoh, linewidth=2, label='Incoherent')
plt.plot(energy, mu_coher, linewidth=2, label='Coherent')

plt.xlabel('Energy (eV)')
plt.ylabel(r'$\mu/\rho \rm\, (cm^2/gr)$')
plt.legend()
plt.yscale('log')
plt.show()
which will generate the following plot:
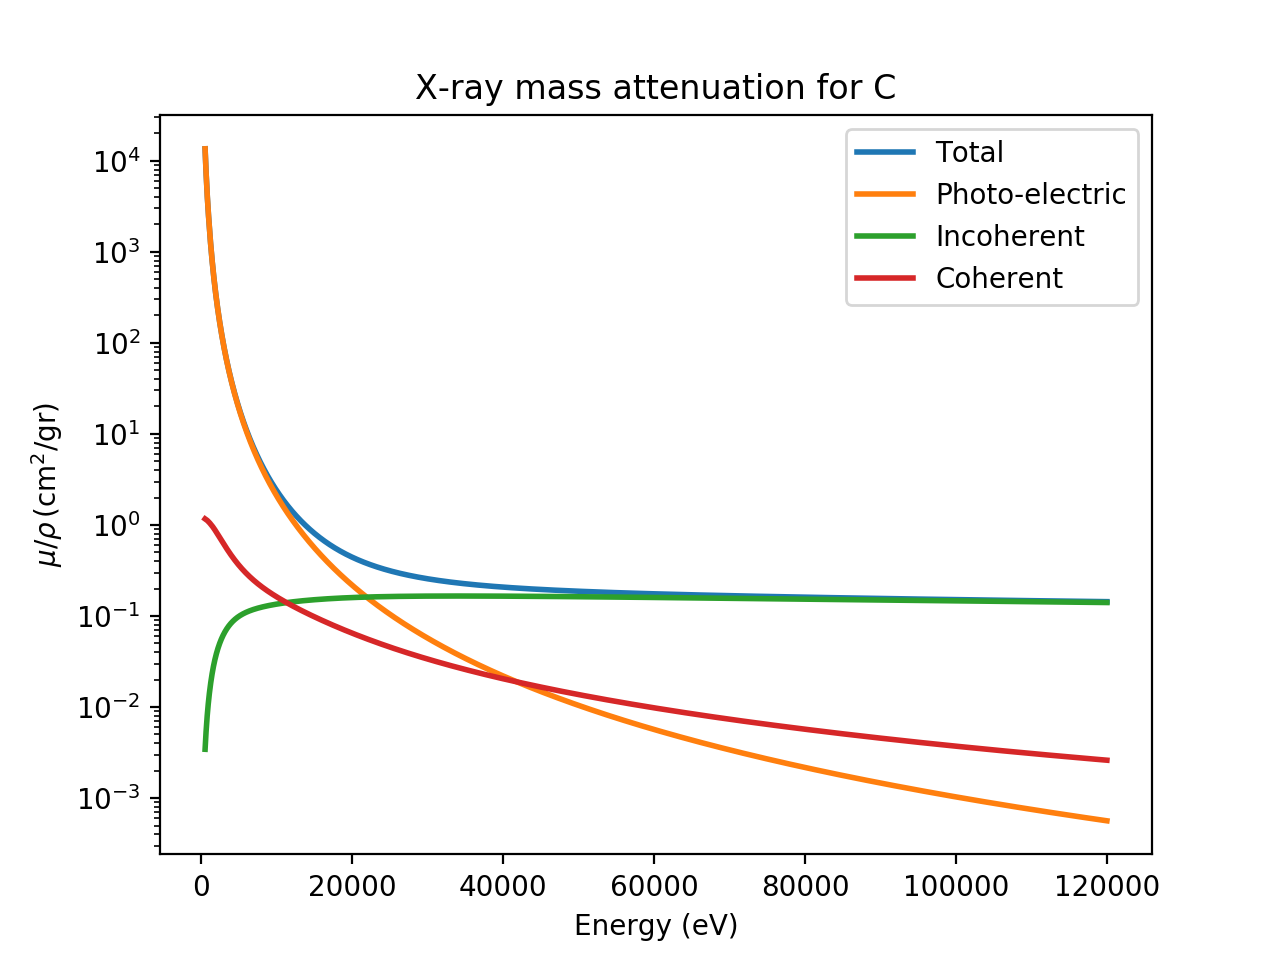
X-ray scattering and attenuation factors for C.
Note that above 20 keV, the photo-electric absorption and incoherent Compton contributions are about equal, and that the Compton scattering dominates above 50 keV. As shown above, the photo-electric scattering will be much higher for heavier elements. The Rayleigh and Compton scattering have a much weaker dependence on Z, so that the photo-electric process dominates to higher energies. Replacing ‘C’ with ‘Fe’ in the script above will generate the following plot:
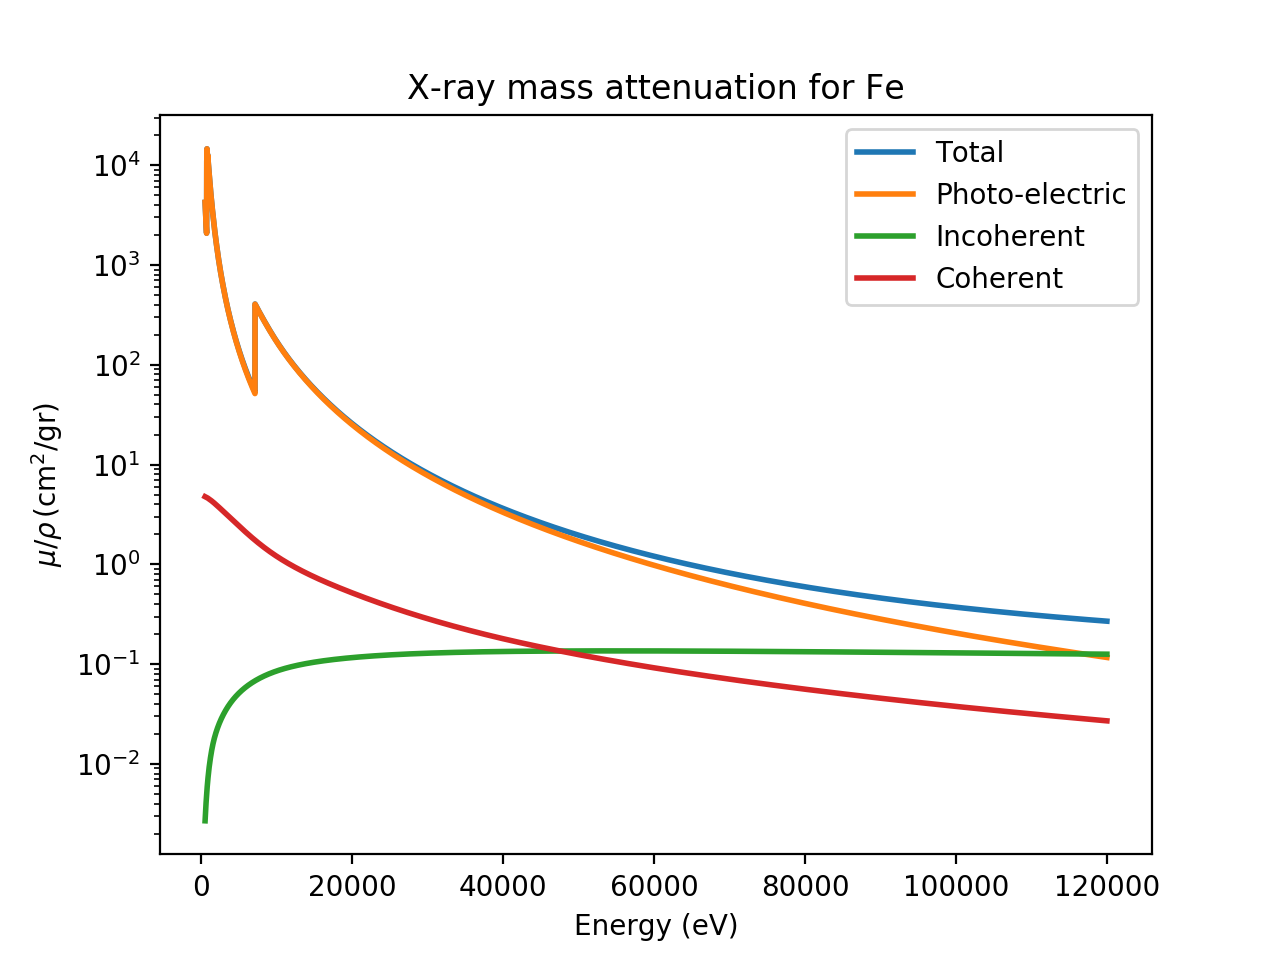
X-ray scattering and attenuation factors for Fe.
which shows that the Compton scattering reaching about 0.1 to 0.25 \(\rm cm^2/gr\) for Fe, about the same value as it was for C, while the photo-electric cross-section dominates past 100 keV.
\(\mu\) calculations for materials
While one can use the above values for \(\mu/\rho\) to calculate the
attenuation of X-rays by multi-element materials, the material_mu()
function is available to do the more convenient calculation of the X-ray
absorption coefficient \(\mu\) in units of 1/cm for a material and
energy value and density (which are known for several common materials).
This gives the length for which X-ray intensity is reduced by a factor of
e, and so can be used to calculate the fraction of the X-rays transmitted
through a material of known thickness, as \(\exp(-t\mu)\) for a
material of thickness t. As a first example, we calculate the the
fraction of X-ray transmitted through 1 mm of the water as a function of
X-ray energy:
#!/usr/bin/env python
# XrayDB example script    python/examples/mu_water.py
#
# calculate the fraction of X-rays transmitted through 1 mm of water
#
import numpy as np
import matplotlib.pyplot as plt

from xraydb import material_mu

energy = np.linspace(1000, 41000, 201)

mu = material_mu('H2O', energy)

# mu is returned in 1/cm
trans = np.exp(-0.1 * mu)

plt.plot(energy, trans, label='transmitted')
plt.plot(energy, 1-trans, label='attenuated')
plt.title('X-ray absorption by 1 mm of water')
plt.xlabel('Energy (eV)')
plt.ylabel('Transmitted / Attenuated fraction')
plt.legend()
plt.show()
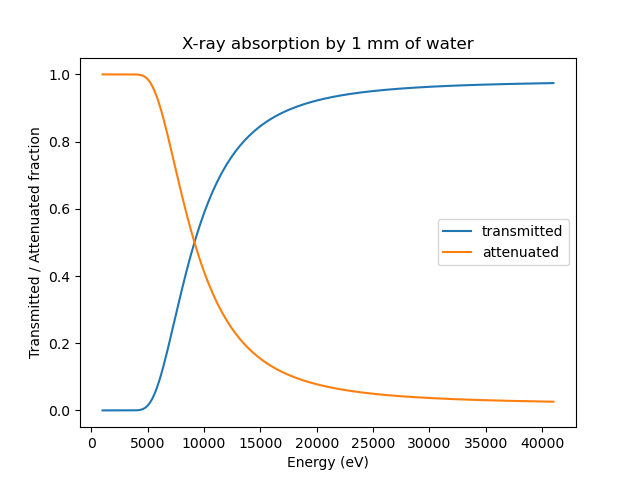
Fraction of X-rays absorbed and transmitted by water
replacing:
mu = material_mu('H2O', energy)
with:
mu = material_mu('CaCO3', energy, density=2.71)
would generate the following plot
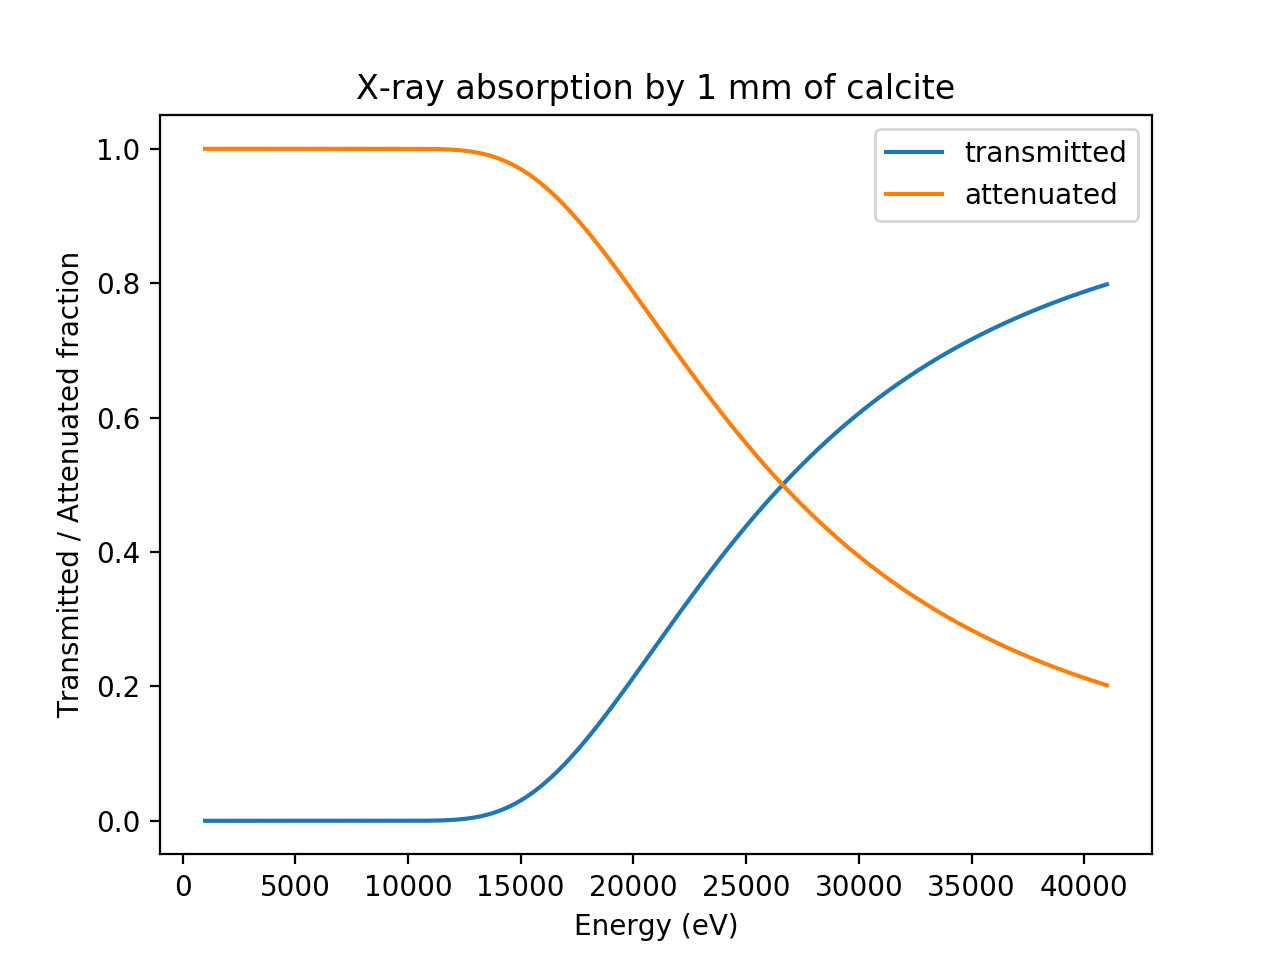
Fraction of X-rays absorbed and transmitted by calcite
For many X-ray experiments, selecting the size of a material size so that its thickness is approximately 1 to 2 absorption length is convenient so that X-ray scattering and emission can be observed strongly, with neither all primary and scattered X-rays being absorbed by the material itself, but also not simply passing through the material without any interaction. For example, one can simply do:
>>> from xraydb import material_mu
>>> mu_20kev = xraydb.material_mu('CaCO3', 20000, density=2.71)
>>> print("CaCO3 1/e depth at 20keV = {:.3f} mm".format(10/mu_20kev))
CaCO3 1/e depth at 20keV = 0.648 mm
X-ray flux calculations for ionization chambers and photodiodes
Gas-filled ionization chambers are widely used as X-ray detectors. They are simple to use, inexpensive, and can give highly linear measures of photon flux over many orders of magnitude. X-rays entering a chamber filled with an inert gas (typically He, N2, or one of the noble gases, or a mixture of these) will be partially absorbed by the gas, with the strong energy dependence shown above. By adjusting the composition of the gas, nearly any fraction of the incident X-ray beam can be absorbed at a particular X-ray energy, making these ideal detectors to sample the intensity of an X-ray beam incident on a sample, while attenuating only a fraction of the beam.
Some of the X-rays in the gas will be absorbed by the photo-electric effect which will ionize the gas, generating free electrons and energetic ions. The first ionization event will generate an electron-ion pair with the energy of the X-ray minus the binding energy of the core electron. The high-energy electron and ion pair will further ionize other gas molecules. With an electric potential (typically on the order of 1 kV /cm) across the plates of the chamber, a current is generated that is proportional to the X-ray energy and fluence of the X-rays.
Effective Ionization Potentials of gases and semiconductors
The process of converting the X-ray generated current into X-ray fluence involves several steps. The energy from a single X-ray-generated electron is converted into a number of electron-ion pairs given by the effective ionization potential of the gas. These values are available from a few sources and range between 20 and 40 eV, given in the Table of Effective Ionization Potentials.
Table of Effective Ionization Potentials. Many of these are taken from [Knoll (2010)], while others appear to come from International Commission on Radiation Units & Measurement, Report 31, 1979. The names given are those supported by the functions
ionization_potential()andionchamber_fluxes().
gas/material name(s)
potential (eV)
hydrogen, H
36.5
helium, He
41.3
nitrogen, N, N2
34.8
oxygen, O, O2
30.8
neon, Ne
35.4
argon, Ar
26.4
krypton, Kr
24.4
xenon, Xe
22.1
air
33.8
methane, CH4
27.3
carbondioxide, CO2
33.0
silicon, Si
3.68
germanium, Ge
2.97
From this table, we can see that the absorption (by photo-electric effect) of 1 X-ray with energy 10 keV will generate about 300 electron-ion pairs. That is not much current, but if \(10^8 \,\rm Hz\) X-rays are absorbed per second, then the current generated will be around 5 nA. Of course, the length of the gas or more precisely the length of gas under ionizing potential will have an impact on how much current is generated. The photo-current generated can be amplified and converted to a voltage using a current amplifier, and that voltage will then recorded by a number of possible mean: a voltage-to-frequency generator and a digital counter is a common method for integrated current for a specific amount of time, but other sampling methods can also be used.
An ion chamber can be linear over many orders of magnitude of X-ray flux, provided the potential between the plates is high enough - typically in the 1 kV/cm range to efficiently collect all the charged particles before the recombine. As an important practical note, a typical current amplifier at a particular setting of sensitivity will be linear only over a limited range (often over an output voltage of 0.02 to 5 V). Because of this, the sensitivity of the current amplifier used with an ion chamber needs careful attention to avoid saturation and maintain sensitivity.
A photo-diode works in much the same way as an ionization chamber. X-rays incident on the diode (typically Si or Ge) will be absorbed and generate a photo-current that can be collected. Typically PIN diodes are used, and a small reverse bias voltage is often applied. Because the electrons do not need to escape the material but generate a current transported in the semiconductor, the effective ionization potential is much lower - a few times the semiconductor band gap instead of a few time the lowest core-level ionization potential. The current generated per X-ray will therefore be larger than for an ion chamber, and will also generally have a much faster response time. The generated current will still measured in the same manner as a gas-filled ionization typically using a current amplifier and integrating counter. Of course, the thickness of the diode is difficult to adjust. The active length of diodes are typically a few hundred microns, and so are generally much more absorbing than an ion chamber.
Compton scattering and Ion Chamber Current
In addition to photo-electric absorption, X-rays can be attenuated by gas molecules in an ion chamber by incoherent (Compton) or coherent (Rayleigh) scattering processes. The coherent scattering will not generate any electrons in the gas, but will elastically scatter X-rays out of the main beam. On the other hand, incoherent scattering will generate some current, though typically only a small portion of the incident X-ray energy is given to a scattered electron. In fact, Compton scattering has a distribution of energies given to the scattered electron depending on the angle of scattering, so that the energy of the scattered electron is
where \(E_{\gamma}\) is the incident X-ray energy, and \(\theta\) is the scattering angle. From this, it easy to estimate the median energy of electrons generated by Compton scattering X-rays of energy \(E\) at 90 degrees will be
(recall that \(1 - 1/(1+x) = 1 / (1+1/x)\)). For X-rays of 10 keV, \(E_{\rm median}\) is about 192 eV. For 20 keV X-rays, it will be 750 eV, and for 50 keV X-rays, it will be 4.5 keV. Because of the angular distribution of Compton scattering is not uniform, these median values over-estimate the amount of energy transferred to the scattered electron by a small amount that increases with energy. The mean energy of the Compton-scattered electron can be found by integrating the Klein-Nishina distribution. Since these values depend only on the incident X-ray energy, these calculations have been done and the values tabulated in the Compton_energies table in the XrayDB sqlite database.
Although the energy transferred to the electron by Compton scattering is much less than by the photo-electric process the contribution can be important. This is especially true for low-Z gas molecules such as He and N2 at relatively high energies (10 keV and above) for which incoherent scattering becomes much more important than photo-electric absorption, as shown above for C. That is, for accurate estimates of fluxes from ion chamber currents at energies about 20 keV or so, the contribution from Compton scattering should be included. For photo-diodes (typically made of Si), the Compton scattering cross-section exceeds the photo-electric cross-section about 56 keV, and so should also be included for high-energy X-ray measurements.
Ion Chamber Flux calculations
The conversion of incident flux at a particular energy to generated current is not too difficult if considering only the photo-electric effect of a single gas, but can be somewhat subtle in the more general case. For the discussion here, we assume that the potential across the plates of the ion chamber is high enough to prevent any recombination of charged particles.
For a given gas at an incident X-ray energy \(E\), we calculate the total, photo-electric, incoherent (Compton), and coherent (Rayleigh) values of \(\mu\). If more than one gas is used, the weighted sum is calculated, so that we have \(\mu_{\rm total}\), \(\mu_{\rm photo}\), \(\mu_{\rm incoh}\), and \(\mu_{\rm coh}\) for the gas in the chamber or diode material.
The flux transmitted out of the chamber is
where \(t\) is the length of the chamber and \(I_{0}\) is the incident flux. These two intensities are the quantity we are most interested in. The attenuated flux (in number per second, or Hz) is
can be separated into the various source of attenuation as
The photo-electric effect converts all of the X-ray energy into a current of both electrons and ions using the effective ionization potential above:
where \(q_{e}\) is the electron charge (\(1.6\times10^{-19} \rm{C}\)), \(E\) is the incident X-ray energy (in eV), \(I_{\rm photo}\) is the flux (in Hz), and \(V_{\rm eff}\) is the effective ionization potential for the gas. The leading 2 comes because both electrons and ions are typically counted for the current from an ion chamber. It is sometimes useful to add a Frisch mesh grid to collect the slower ions and shunt them so as to not count that portion of the current, and thereby give the ion chamber a faster time response. In that case, the current will be half of the value given above.
As discussed above, the coherent (Rayleigh) scattering produces no electrons, but the incoherent (Compton) scattering does, and the energy of the the Compton-scattered electron varies with both X-ray energy and scattering angle, as does the probability of scattering. Integrating over all angles (and assuming the ion chamber is large enough to stop the scattered electrons) gives the mean electron energy, which we use to obtain the current from the incoherent scattering:
where \(E_{\rm mean}\) is the mean energy of Compton-scattered electron (approximately, but slightly less than the \(E_{\rm median}\) value above.
The current from an ion_chamber is typically measured as a voltage generated by a current-to-voltage amplifier. The measured voltage will have a gain or sensitivity in units of A/V. The goal is typically to calculate the flux \(I_0\) from the measured voltage and knowledge of the sensitivity as well as the gas(es), ion chamber length \(t\), and X-ray energy \(E\). The measured voltage is given by
where \(S\) is the amplifier sensitivity in A/V. From this, \(I_0\) and \(I_{\rm trans}\) can be calculated.
ionchamber_fluxes()
The function ionchamber_fluxes() will calculate X-ray fluxes
for an ion chamber as described above the following inputs:
gas: the gas, or mixture of gases used or ‘Si’ or ‘Ge’ for diodes.
length: the length of the ion chamber, in cm.
energy: the X-ray energy, in eV.
volts: the output voltage of the current amplifier
sensitivity and sensitivity_units: the sensitivity or gain of the amplifier used to convert the photo-current to the recorded voltage.
with_compton: whether to include the current generated by Compton-scattered electrons [True]
both_carriers: whether to include the current generated by both positive and negative charged particles [True]
The default sensitivity_units is ‘A/V’ but can be set to any of the common SI prefixes such as ‘p’, ‘pico’, ‘n’, ‘nano’, \(\mu\), (unicode ‘03bc’), ‘u’, ‘micro’, ‘m’, or ‘milli’, so that:
>>> fluxes = ionchamber_fluxes('N2', volts=1, energy=10000, length=10,
                               sensitivity=1.e-9)
>>> fluxes = ionchamber_fluxes('N2', volts=1, energy=10000, length=10,
                               sensitivity=1, sensitivity_units='nA/V')
will give the same results.
The output from ionchamber_fluxes() is a named tuple with 4 fields:
photo - the flux absorbed by the photo-electric effect, in Hz.
incoherent - the flux scattered by the Compton effects, in Hz.
incident - the flux incident on the ion chamber, in Hz.
transmitted - the flux beam leaving the ion chamber, in Hz.
As described above, the current in the ion chamber or photo-diode is generated by electrons and ions produced by both the photo-electric and incoherent or Compton scattering. The photo-electric cross-section will dominate for heavy elements and relatively low X-ray energies, but does not necessarily dominate at high X-ray energies. The photo-electric cross-section with the incident X-ray energy and the incoherent cross-section with the *mean* Compton-scattering energy, using the calculated and tabulated mean energies of the Compton-scattered electrons are used to estimate the incident flux from the photo-current. The total attenuation cross-section, including the coherent cross-sections, is used to calculate the transmitted flu from the incident flux.
As an example calculation of ion chamber currents:
>>> fl = ionchamber_fluxes(gas='nitrogen', volts=1.25, energy=18000,
                               length=10.0, sensitivity=1.e-6)
>>> print(f"Incident= {fl.incident:g} Hz, Transmitted flux= {fl.transmitted:g} Hz")
Incident= 2.2358e+12 Hz, Transmitted flux= 2.214e+12 Hz
It is not uncommon for an ion chamber to be filled with a mixture of 2 or more gases so as to better control the fraction of X-rays absorbed in a chamber of fixed length. This can be specified by passing in a dictionary of gas name and fractional density, as with:
>>> fl = ionchamber_fluxes(gas={'Kr':0.5, 'Ar': 0.5}, volts=1.25,
                           energy=18000, length=10,
                           sensitivity=1, sensitivity_units='microA/V')
>>> print(f"Incident= {fl.incident:g} Hz, Transmitted flux= {fl.transmitted:g} Hz")
Incident= 1.43737e+10 Hz, Transmitted flux= 3.28986e+09 Hz
Finally, the pressure of the gas is sometimes adjusted to alter the fraction of the beam absorbed. The calculations here all use the densities at STP, but changes in gas density will be exactly linear to changing the length of the ion chamber.
X-ray mirror reflectivities
At very shallow angles of incidence X-rays can be reflected by total external reflection from a material. The reflectivity can be very high at relatively low energies and shallow angles, but drops off dramatically with increasing energy, increasing angle, and decreasing electron density. Still, this reflectivity is one of the few ways to steer X-ray beams and so is widely used in synchrotron radiation sources.
Single Layer mirrors
The reflectivity can be calculated with the mirror_reflectivity()
function which takes X-ray energy, incident angle, and mirror material as
arguments.
An example script, comparing the energy-dependence of the reflectivity for a few common mirror materials is given as
import numpy as np
from xraydb import mirror_reflectivity
import matplotlib.pyplot as plt

energy = np.linspace(1000, 51000, 501)

r_si = mirror_reflectivity('Si', 0.002, energy)
r_ni = mirror_reflectivity('Ni', 0.002, energy)
r_rh = mirror_reflectivity('Rh', 0.002, energy)
r_pt = mirror_reflectivity('Pt', 0.002, energy)

plt.plot(energy, r_si, label='Si')
plt.plot(energy, r_ni, label='Ni')
plt.plot(energy, r_rh, label='Rh')
plt.plot(energy, r_pt, label='Pt')

plt.title('X-ray reflectivity at $\\theta=2 \\mathrm{mrad}$')
plt.xlabel('Energy (eV)')
plt.ylabel('Reflectivity')
plt.legend()
plt.show()
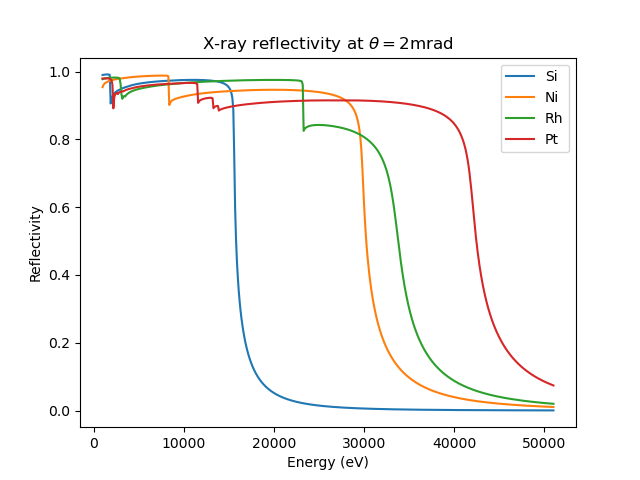
X-ray mirror reflectivity at \(\theta = 2\mathrm{mrad}\) for selected mirror surfaces and coatings used for mirrors.
Multilayer Mirrors
For more complex mirrors, such as those made of multiple materials,
the reflectivity can be calculated with Parratt’s Recursive Method
using the multilayer_reflectivity() function. This function
takes a list of materials from top to bottom, a matching list of
thicknesses of each layer, substrate material, incident angle, energy,
and the number of periods.
An example usage, calculating the reflectivity at 1000 eV vs. grazing angle for a 40*[Si, W] layered mirror on SiO2 substrate is given as
import numpy as np
from xraydb import multilayer_reflectivity
import matplotlib.pyplot as plt

# 40 layers of [27Ang Si, 18Ang W]
materials = ['Si', 'W']
thicknesses = [27, 18] # angstroms
n_periods = 40
substrate = 'SiO2'
theta = 0.01
energy = np.linspace(500, 20000, 5000)

reflect = multilayer_reflectivity(materials, thicknesses, substrate,
                                  theta, energy, n_periods=n_periods)

plt.plot(energy, reflect)
plt.title(f'$\\rm 40 x [27\\AA\\, Si,\\, 18\\AA\\, W] \\> multilayer \\> \\theta\\, = \\, {theta*1000:.0f}\\> mrad$')
plt.xlabel('Energy (eV)')
plt.ylabel('Reflectivity')
plt.show()
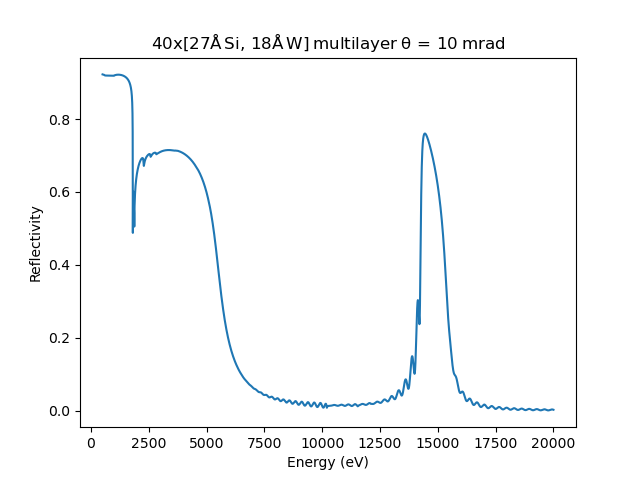
Coated mirrors
In principle, reflectivity calculation for coated mirrors is the same
as for multilayer mirrors; however, coated_reflectivity`() is
provided to simplify the recursion and have more clear input
parameters. The function takes top layer material and thickness,
substrate material and thickness, incident angle, energy, and optional
binding layer parameters.
An example script calculating the reflectivity at \(\theta = 4 \mathrm{mrad}\) for a rhodium slab and rhodium coated mirror is given as
import numpy as np
from xraydb import (coated_reflectivity, mirror_reflectivity)
import matplotlib.pyplot as plt

coating = 'Rh'
coating_thick = 300
substrate = 'Si'
theta = 0.004
energy = np.linspace(10000, 35000, 500)
binder = 'Cr'
binder_thick = 30

refl_coat = coated_reflectivity(coating, coating_thick, substrate, theta, energy, binder=binder, binder_thick=binder_thick)
refl_rhod = mirror_reflectivity('Rh', theta, energy)

title = f'$\\rm {coating_thick} \\AA \\> {coating}/{binder_thick} \\AA \\> {binder} \\> coated \\> {substrate} \\> mirror \\> \\theta\\, =\\, {theta*1000:.0f} mrad $'
plt.plot(energy, refl_coat, label='Rh coated')
plt.plot(energy, refl_rhod, label='Rh bulk')
plt.title(title)
plt.xlabel('Energy (eV)')
plt.ylabel('Reflectivity')
plt.yscale('log')
plt.legend()
plt.show()
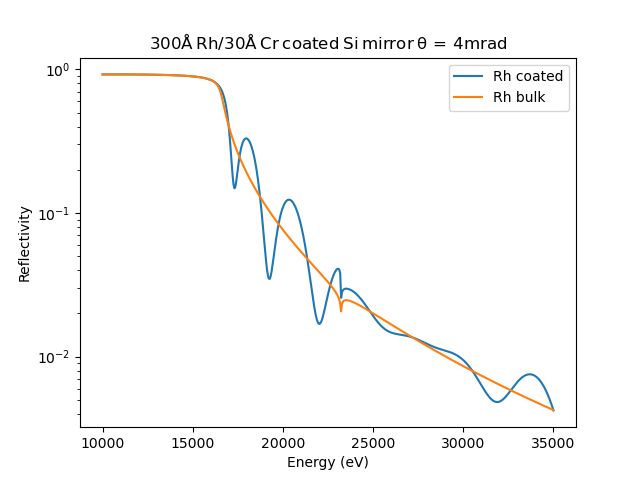
X-ray reflectivity of a rhodium on silicon mirror with a 3 \(\mathrm{\AA}\) chromium binding layer compared to a pure slab of rhodium.
Darwin widths of monochromator crystals
Bragg’s law describes X-ray diffraction from crystals as
where \(\lambda\) is the X-ray wavelength, \(d\) the d-spacing of
the crystal lattice plane, \(\theta\) the incident angle, and \(m\)
the order of the reflection. For imperfect crystals, in which the lattice
planes are not stacked perfectly over extended distances, the angular width
of any particular reflection is dominated by the spread in d-spacing and
the mosaicity inherent in the crystal. For perfect crystals, however, the
angular width of a reflection is dominated by the fact that effectively all
of the X-rays will scatter from the lattice well before any attenuation of
the X-ray beam occurs. This dynamical diffraction gives a small but
finite offset from the Bragg angle, and gives a broadened angular width to
reflection. This is usually called the Darwin width (named for
Charles G. Darwin, grandson of the more famous Charles R. Darwin). In
addition, the refraction and in particular the absorption effects that give
anomalous scattering (as calculated with xray_delta_beta()) make the
“rocking curve” of reflected intensity as a function of angle an asymmetric
shape.
All of these effects are included in the darwin_width() function,
which follows very closely the description from chapter 6.4 in
[Als-Nielsen and McMorrow (2011)]. The function takes inputs of
energy: the X-ray energy, in eV.
crystal: the atomic symbol for the crystal: ‘Si’, ‘Ge’, or ‘C’. [‘Si’]
hkl: a tuple with (h, k, l) of the reflection used. [(1, 1, 1)]
a: lattice constant [None - use nominal value for crystal]
polarization: s, p, or u to specify the X-ray polarization relative to the crystal [s]
m: the order of the reflection. [1]
ignore_f1: whether to ignore f1. [False]
ignore_f2: whether to ignore f2. [False]
Polarization of s should be used for vertically deflecting monochromators at most synchrotron sources (which will normally be horizontally polarized), and p should be used for horizontally deflecting monochromators. For crystals used to analyzed unpolarized X-ray emission, use u, which will give the average of s and p polarization.
As with ionchamber_fluxes(), the output here is complicated enough
that it is put into a named DarwinWidth tuple that will contain the
following fields:
theta - the nominal Bragg angle, in rad
theta_offset - the offset from the nominal Bragg angle, in rad.
theta_width - estimated angular Darwin width, in rad
theta_fwhm - estimated FWHM of the angular reflectivity curve, in rad
rocking_theta_fwhm - estimated FWHM of a rocking curve, in rad
energy_width - estimated energy Darwin width, in eV
energy_fwhm - estimated FWHM energy reflectivity curve, in eV
rocking_energy_fwhm - estimated FWHM of a rocking curve, in eV
zeta - nd-array of \(\zeta = \Delta\lambda/\lambda\).
dtheta - nd-array of angles around from Bragg angle, in rad
denergy - nd-array of energies around from Bragg energy, in eV
intensity - nd-array of reflected intensity at zeta values.
rocking_curve - nd-array of rocking curve of 2 crystals
Here, dtheta will be given by \(\Delta\theta = \zeta \tan(\theta)\), and denergy will be given by \(\Delta{E} = \zeta E\). Note that the rocking_ quantities are estimated as the convolution of the intensity with itself, to simulate an angular scan of one crystal with respect to the other, as is often done with double-crystal monochromators. rocking_theta_fwhm and rocking_energy_fwhm will be the FWHM of this curve in angle and energy, and will typically be ~1.5x the Darwin widths in theta_width and energy_width, respectively.
All of the nd-arrays will be the same size, so that plots of reflectivity can be readily made. An example usage, printing the predicted energy and angular widths is
import numpy as np
from xraydb import darwin_width
import matplotlib.pyplot as plt

dw_si111 = darwin_width(10000, 'Si', (1, 1, 1))
dw_si333 = darwin_width(30000, 'Si', (3, 3, 3))

print(dw_si111.theta_width*1e6)

fmt_string = "Darwin Width for {:s} at {:.0f} keV: {:5.2f} microrad, {:5.2f} eV"
print(fmt_string.format('Si(111)', 10,
                        dw_si111.theta_width*1e6,
                        dw_si111.energy_width))


print(fmt_string.format('Si(333)', 30,
                        dw_si333.theta_width*1e6,
                        dw_si333.energy_width))

dtheta  = dw_si111.dtheta*1e6
denergy = dw_si111.denergy[::-1]

#  slightly advanced matplotlib hackery:
fig, ax = plt.subplots(constrained_layout=True)


ax.plot(dtheta, dw_si111.intensity, label='$I$, Si(111)', linewidth=2)
ax.plot(dtheta, dw_si111.intensity**2, label='$I^2$, Si(111)', linewidth=2)
ax.plot(dw_si333.dtheta*1e6, dw_si333.intensity**2, label='$I^2$ Si(333) 30 keV', linewidth=2)


ax.set_title('X-ray diffraction intensity at 10keV')
ax.set_xlabel('Angle - $\\theta_B$ ($ \\mu \\mathrm{rad}$)')
ax.set_ylabel('Reflectivity')
ax.legend()

plt.show()
which will print out values of:
Darwin Width for Si(111) at 10 keV: 26.96 microrad,  1.34 eV
Darwin Width for Si(333) at 30 keV:  1.81 microrad,  0.27 eV
and generates a plot of
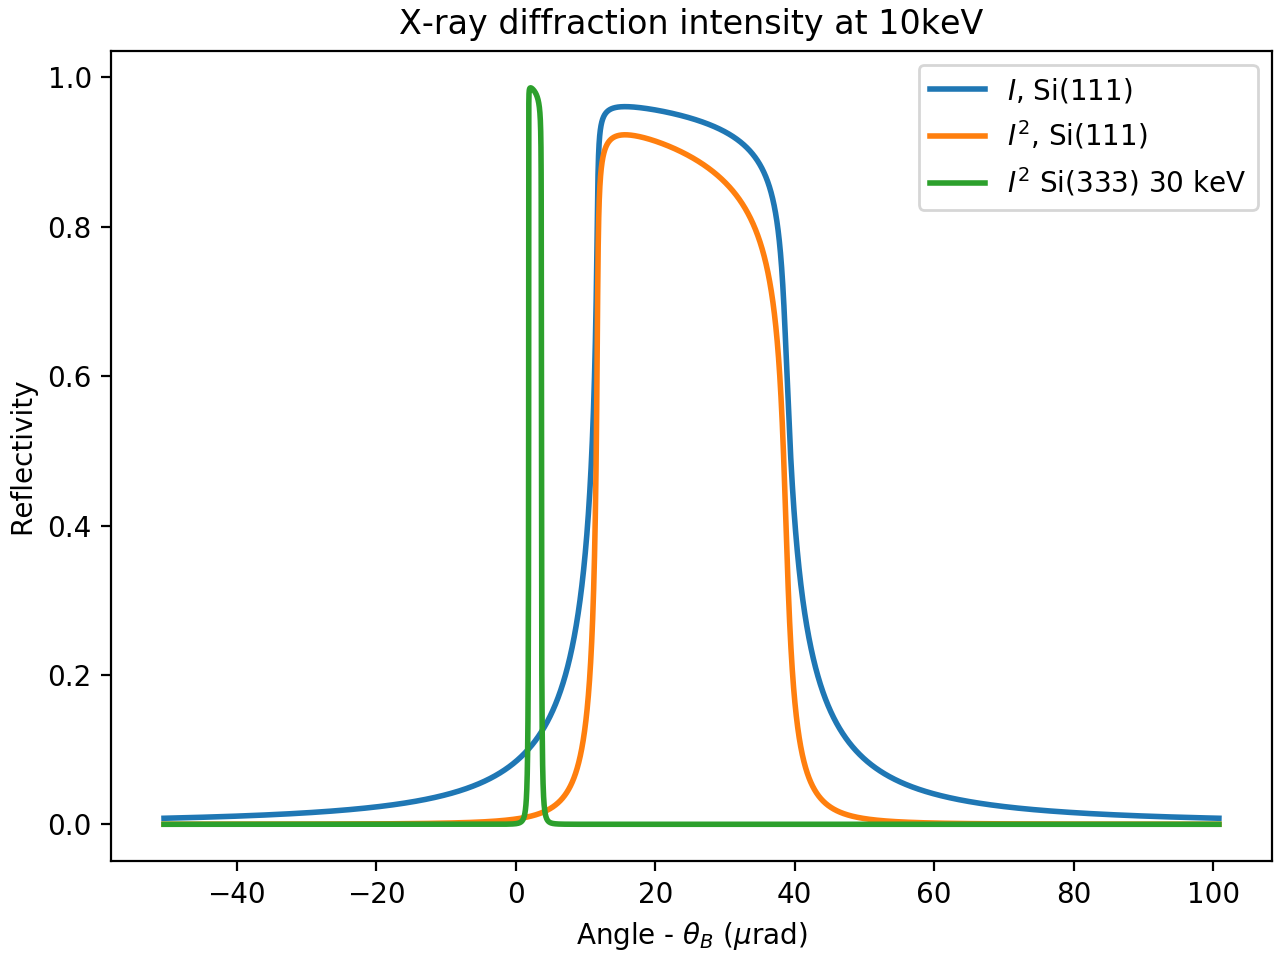
X-ray monochromator diffracted intensities around the Si(111) reflection. Here, \(i\) represents the intensity of a single reflection, and \(i^2\) the intensity from 2 bounces, as for a double-crystal monochromator. The intensity and angular offset of the third harmonic is also shown.
Note that the values reported for theta_fwhm and energy_fwhm will be about 6% larger than the reported values for theta_width and energy_width. The width values closely follow the region of the curve where the reflectivity ignoring absorption would be 1 - the flat top of the curve. Since a double-crystal monochromator will suppress the tails of the reflectivity, this smaller value is the one typically reported as “the Darwin width”, though some sources will report this smaller value as “FWHM”.
An example of the intensity of a single reflection and the “rocking curve” of two crystals is given in
import numpy as np
from xraydb import darwin_width
import matplotlib.pyplot as plt

dw_si111 = darwin_width(10000, 'Si', (1, 1, 1))

dtheta  = dw_si111.dtheta*1e6

fig, ax = plt.subplots(constrained_layout=True)

ax.plot(dtheta, dw_si111.intensity, label='$I$, 1 crystal', linewidth=2)
ax.plot(dtheta, dw_si111.rocking_curve, label='Rocking Curve', linewidth=2)


ax.set_title('X-ray Rocking Curve at 10keV, Si(111)')
ax.set_xlabel('Angle - $\\theta_B$ ($ \\mu \mathrm{rad}$)')
ax.set_ylabel('Reflectivity')
ax.legend()

plt.show()
which generates a plot of
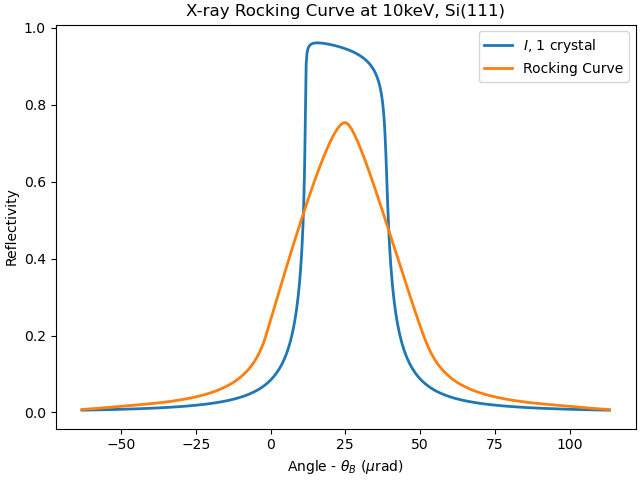
X-ray monochromator rocking curve around the Si(111) reflection. Here, the blue curve shows the intensity of a single reflection, as above, while the orange curve shows the intensity from rocking one crystal through the reflection of the other.