
4.1. Basic Larch GUI
The main Larch Graphical Interface gives a simple view of a Larch session.
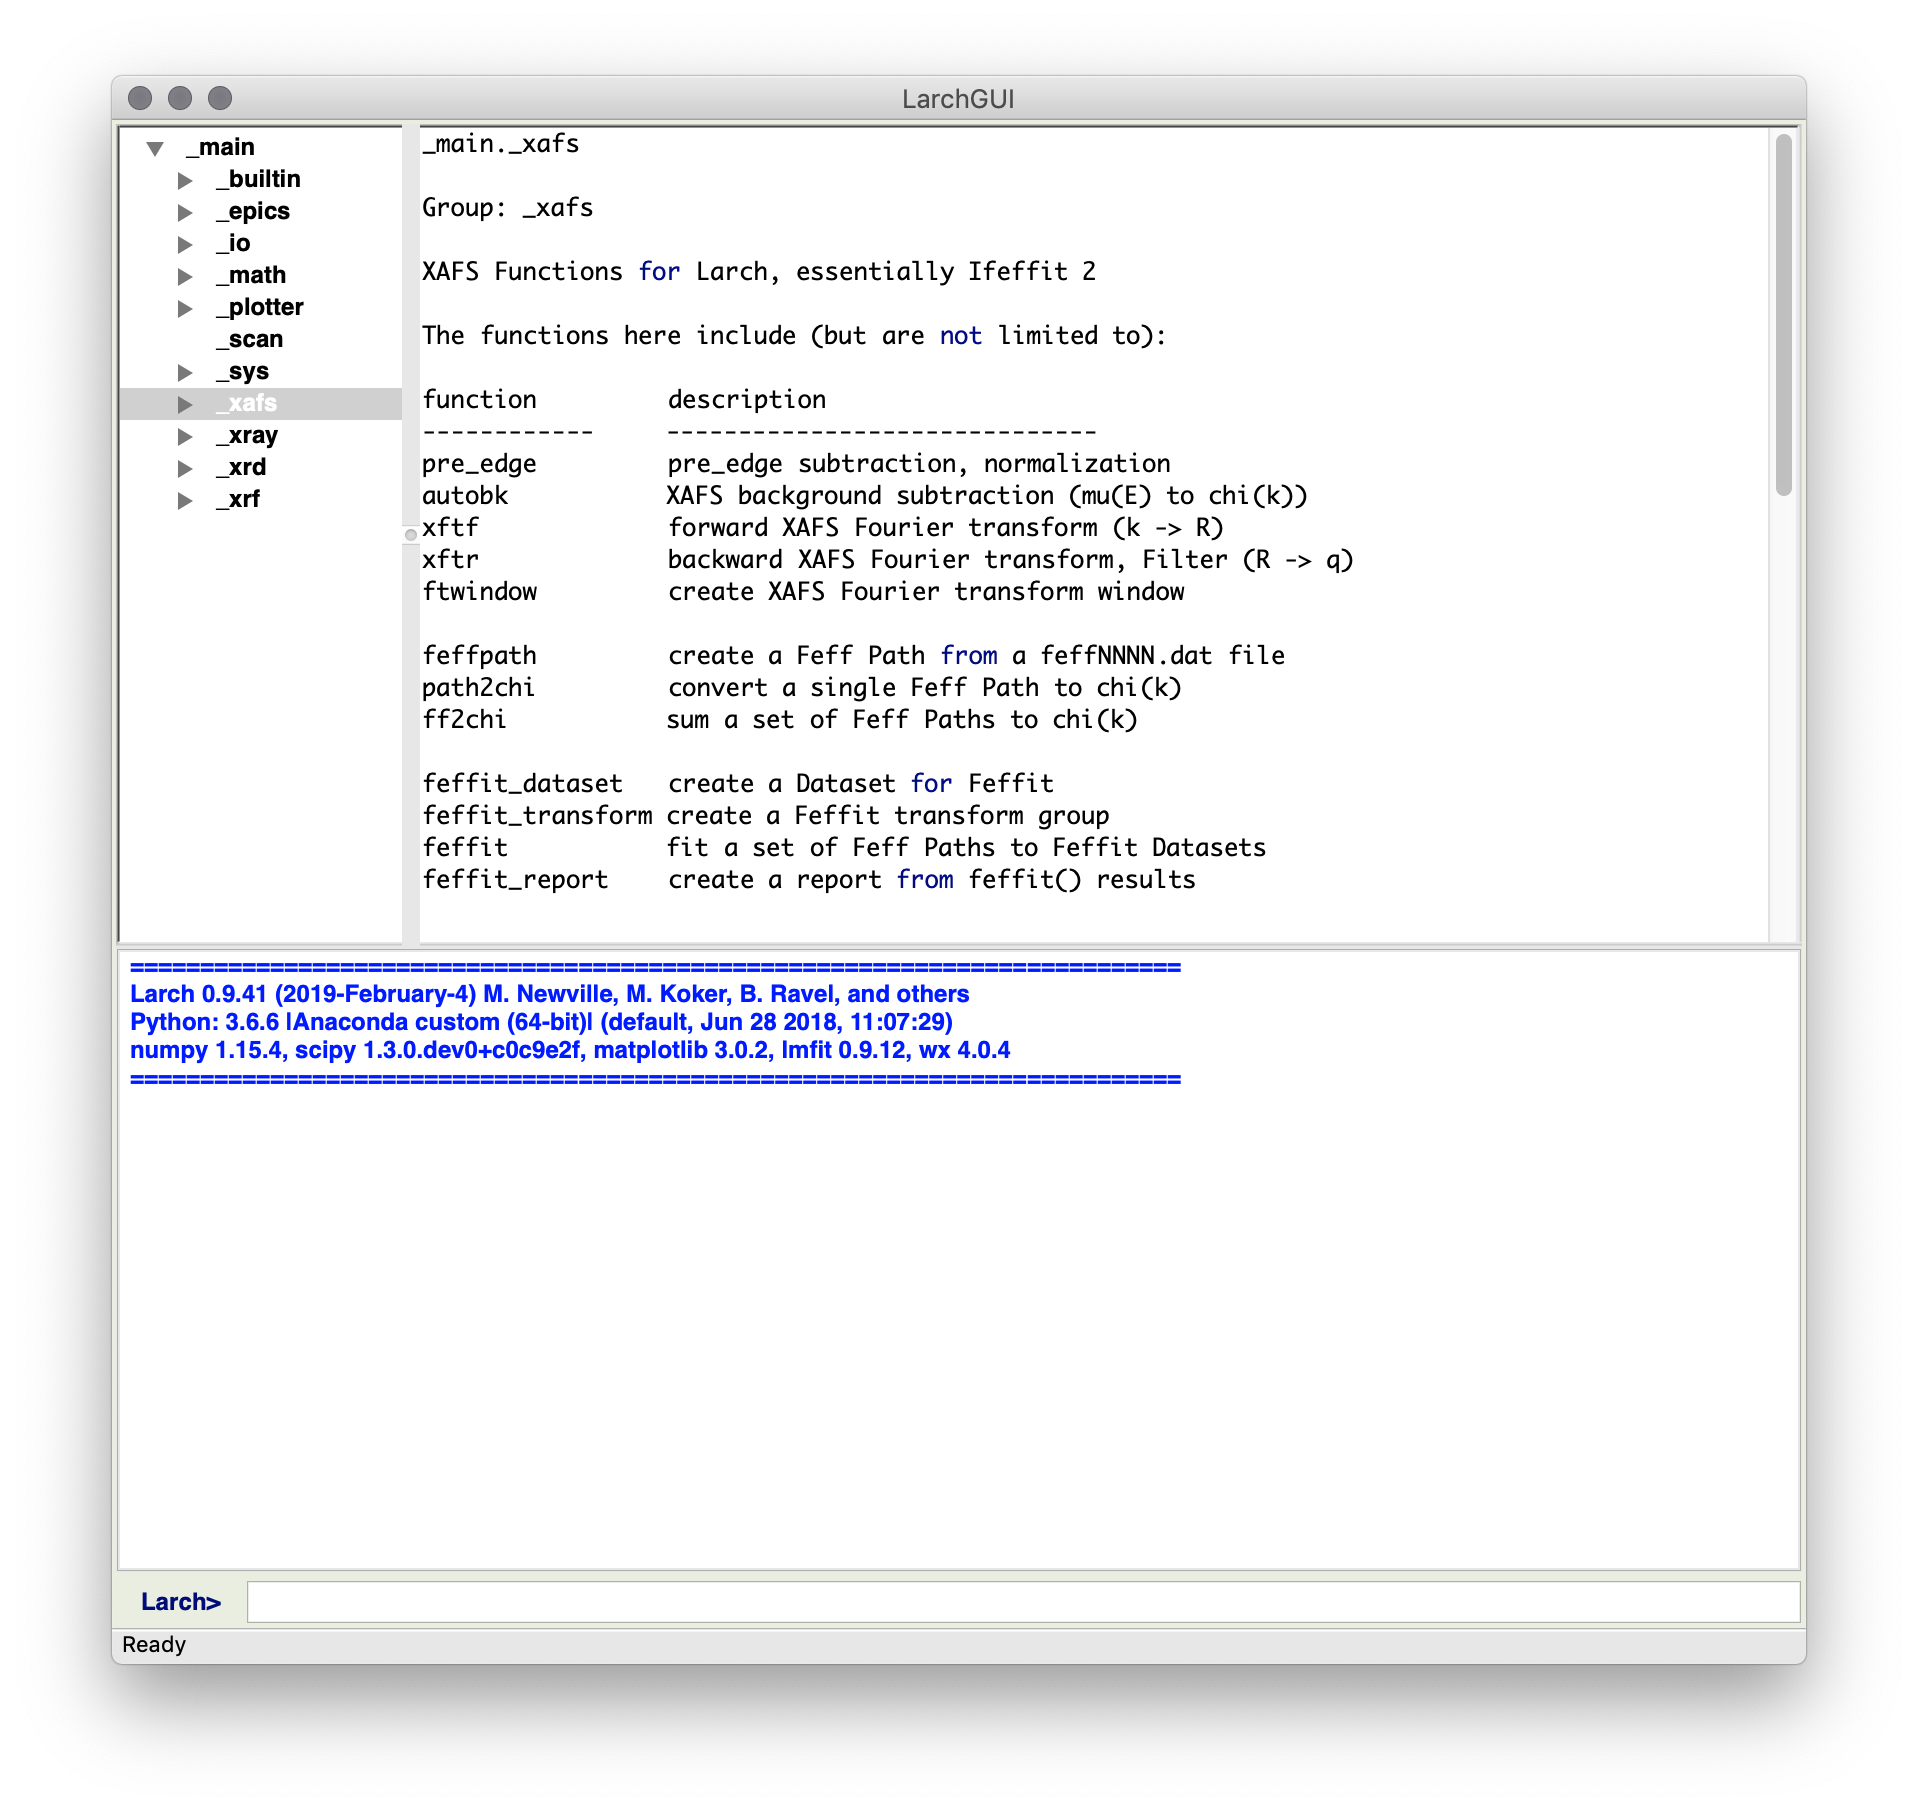
This Graphical Interface enables an interactive Larch session, with a command-line interface at the bottom of the screen. In this window, you can copy or type Larch commands. When you hit Enter or Return, the command will be executed. The history of the commands and any outputs written by the command will be displayed in the output panel taking up most of the bottom half of the main window. The top part of the window shows a Data Browser, from which you can browse through the various groups for modules and datasets, and examine their contents, view function documentation and so on.
This Graphical User Interface is deliberately basic, giving a low-level
interface to Larch commands and data. This is mainly intended for
scripting analysis and debugging. From the File Menu you can read in data
from text column files (using one of _io.read_ascii(), _io.read_xdi(),
or _io.read_gsexdi() as appropriate) or from Athena Project files (using
_io.read_athena() and _io.extract_athenagroup()). You can also load
and run a text file of commands or save the commands run in a session to a file.
The main Larch GUI also provides simple launchers for several of the main Larch Applications, including XAS Viewer.
From the Larch GUI, one can browse and act on data. This includes the ability make Simple plot of 1-D data, using wxmplot. This wraps matplotlib, and gives a fully interactive with point selection, rubber-band zoom, and a configuration frame (right) for the user to select colors and line properties, and so forth.
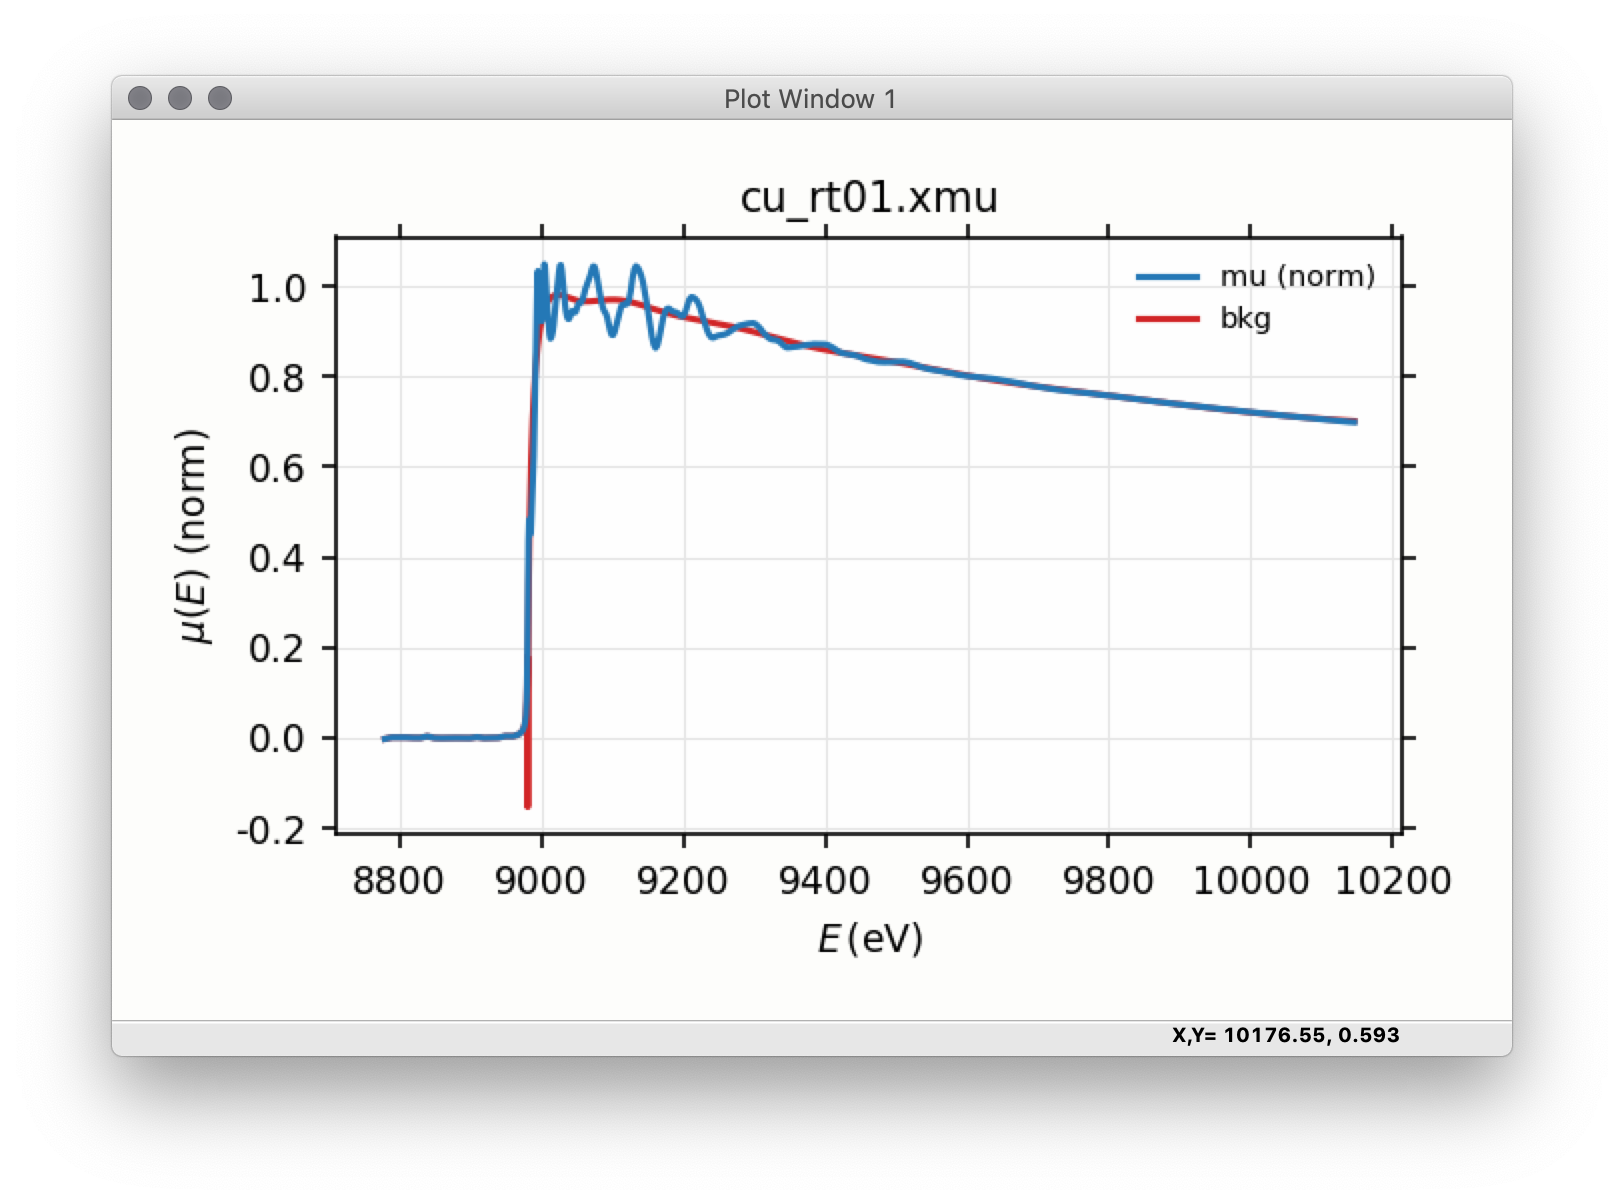
Figure 4.1.1 Basic Plot
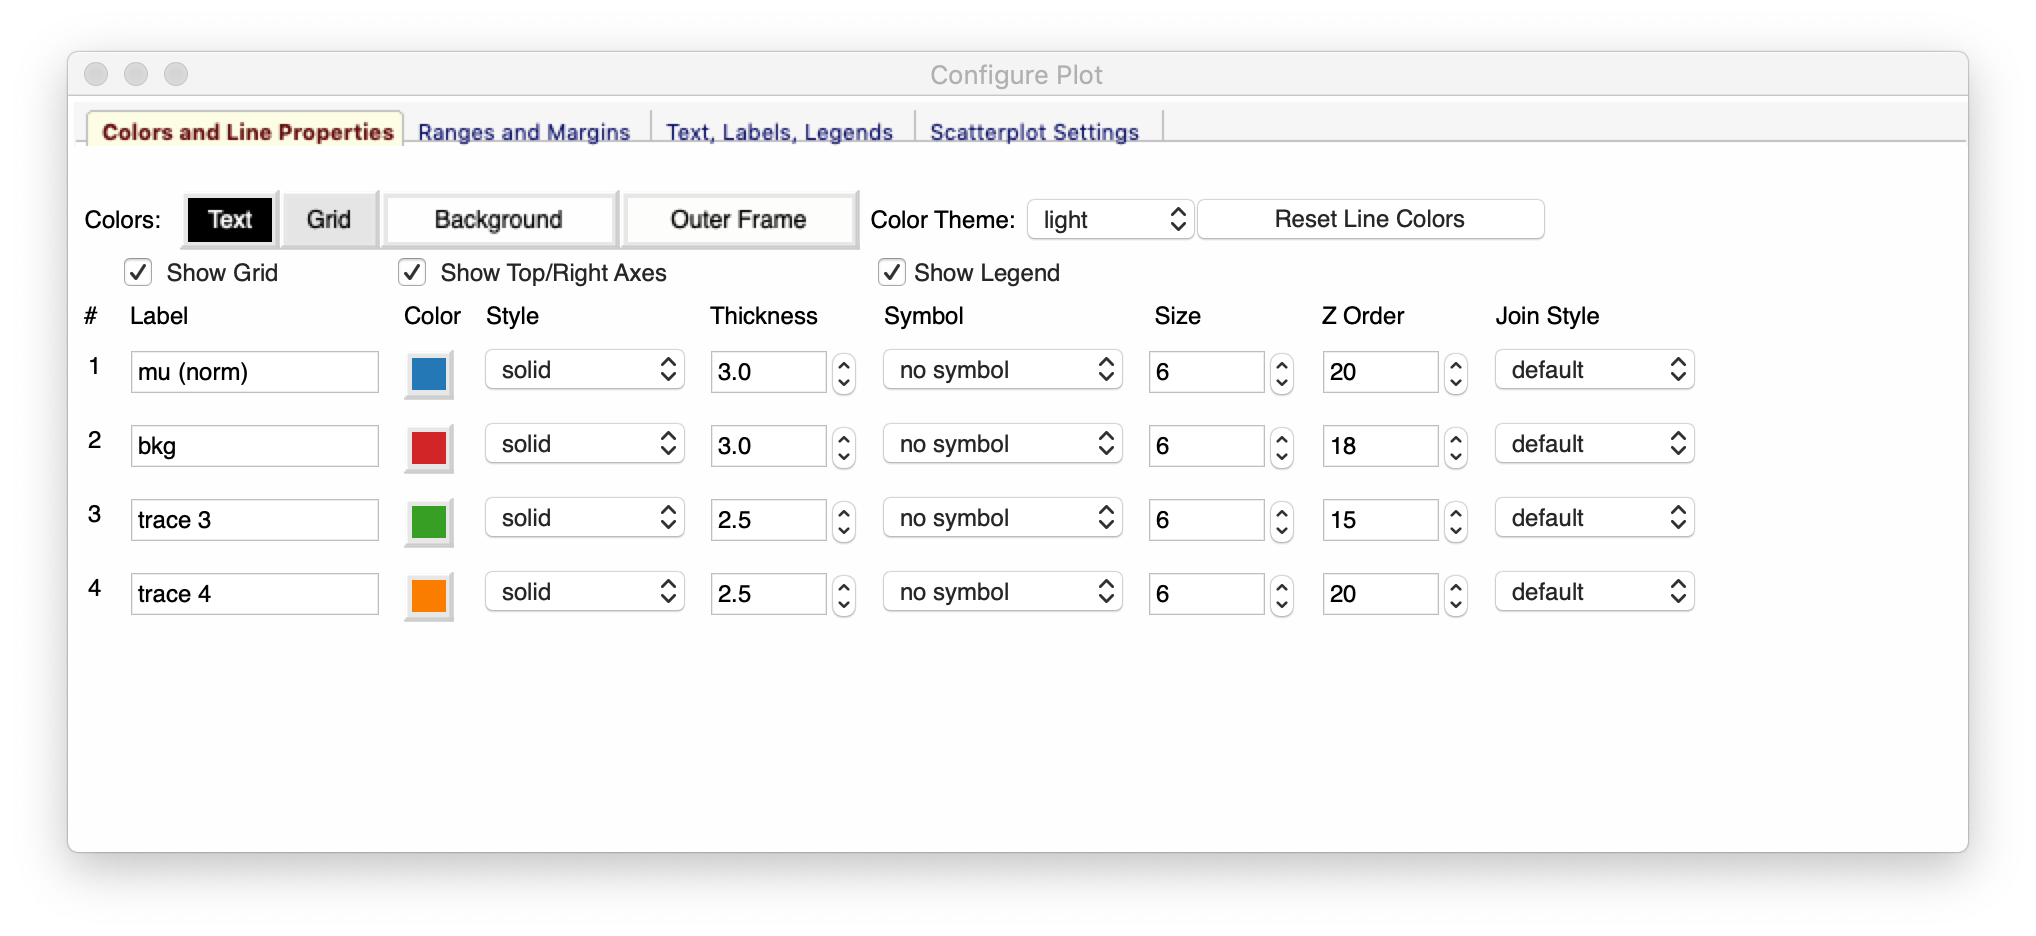
Figure 4.1.2 Plot Configuration Window
Example plots and plot configuration.